AUDUSD – Continuation Chart Pattern – Channel Down
AUDUSD is approaching the support line of a Channel Down. It has touched this line numerous times in the last 3 days. If it tests this line again, it should do so in the next 9 hours. Past performance is not an indicator of future results. Losses can exceed deposits.
GBPUSD – resistance line broken at 2025-06-12T18:00:00.000Z

GBPUSD has breached the resistance line at 1.3587. It may continue the bullish trend towards 1.3654, or, it may prove to be yet another test of this level. Past performance is not an indicator of future results. Losses can exceed deposits.
A potential bearish movement on XAUUSD

Emerging Channel Up detected on XAUUSD – the pattern is an emerging one and has not yet broken through resistance, but the price is expected to move up over the next few hours. The price at the time the pattern was found was 3422.68 and it is expected to move to 3415.9875. Past performance is […]
Either a rebound or a breakout imminent on EURCHF
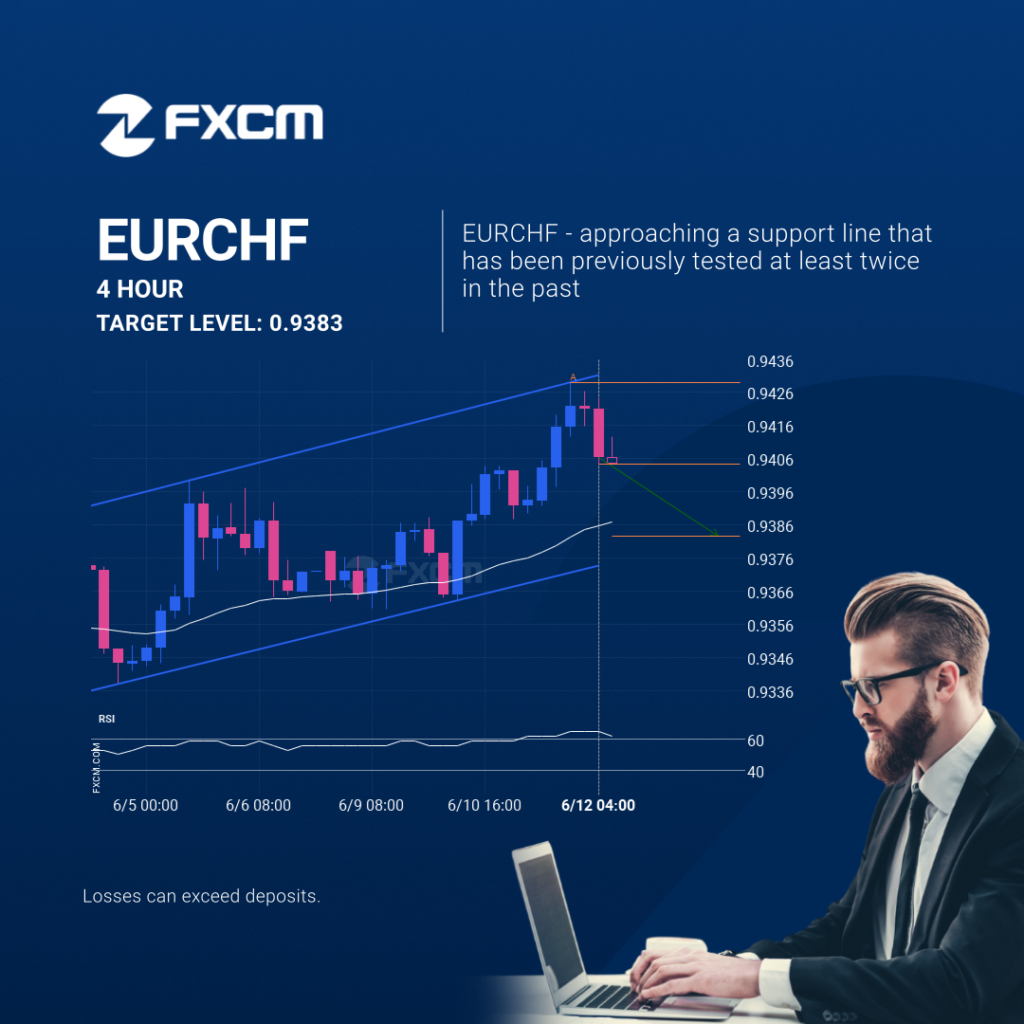
EURCHF is approaching the support line of a Channel Up. It has touched this line numerous times in the last 9 days. If it tests this line again, it should do so in the next 2 days. Past performance is not an indicator of future results. Losses can exceed deposits.
Confirmed breakout on USDCAD 1 hour chart
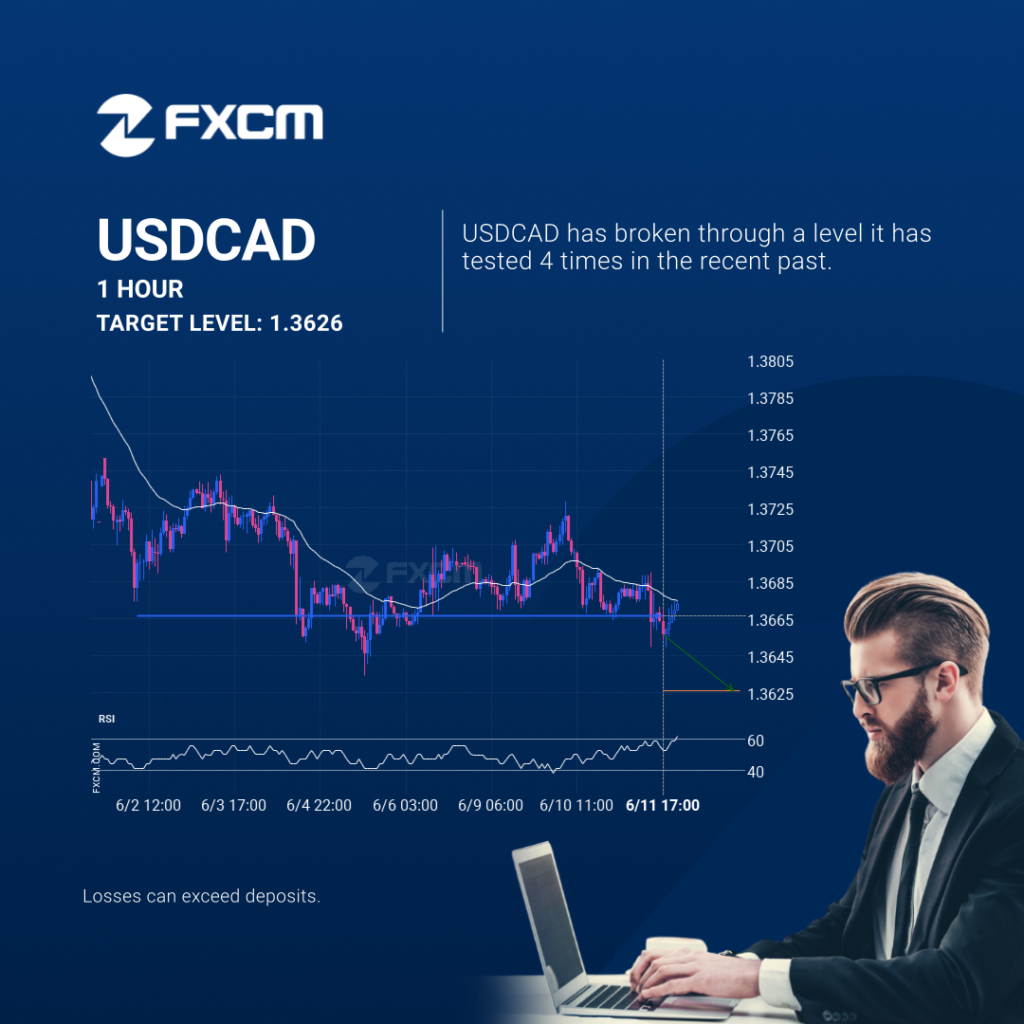
USDCAD has broken through a line of 1.3666 and suggests a possible movement to 1.3626 within the next 2 days. It has tested this line numerous times in the past, so one should wait for a confirmation of this breakout before taking any action. If the breakout doesn’t confirm, we could see a retracement back […]
Possible breach of resistance level by AUDUSD
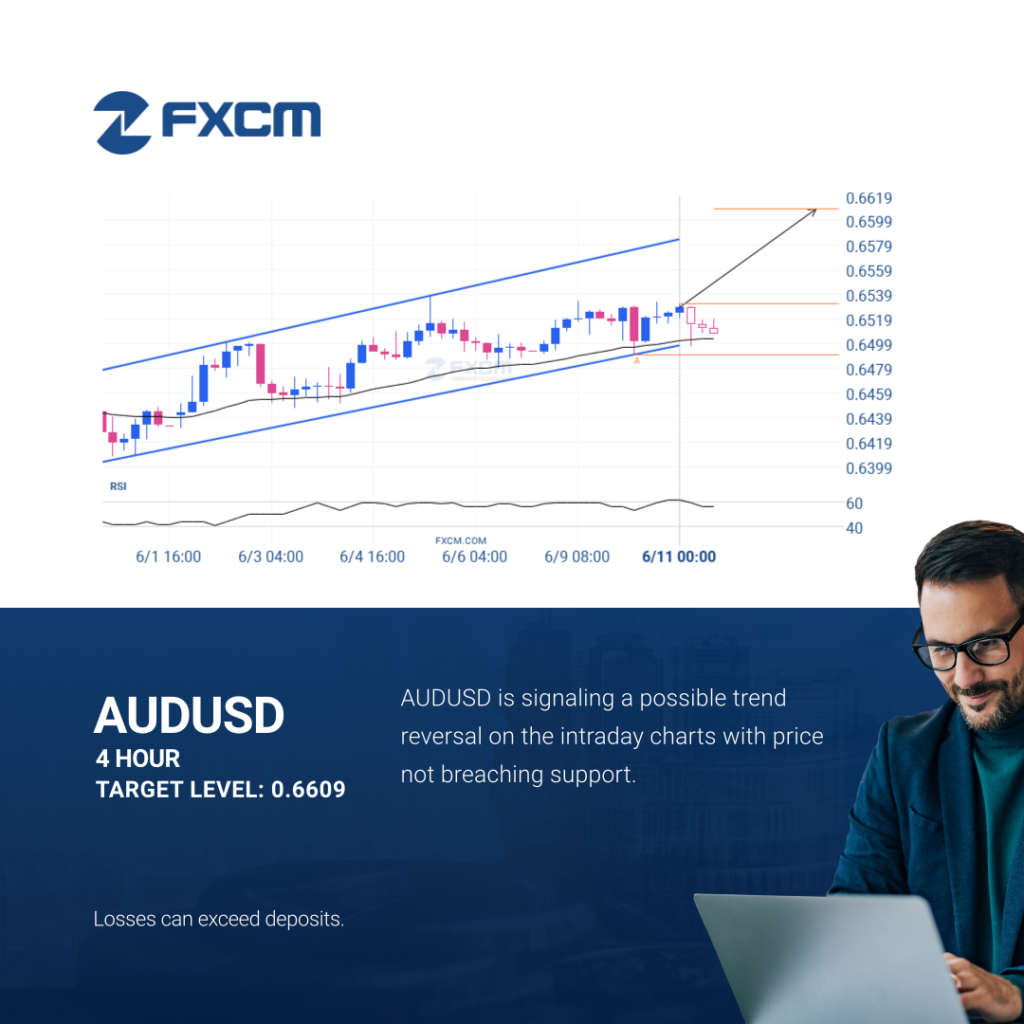
AUDUSD is heading towards the resistance line of a Channel Up. If this movement continues, the price of AUDUSD could test 0.6609 within the next 3 days. It has tested this line numerous times in the past, so this movement could be short-lived and end up rebounding just like it did in the past. Past […]
Possible breach of resistance level by EURCHF
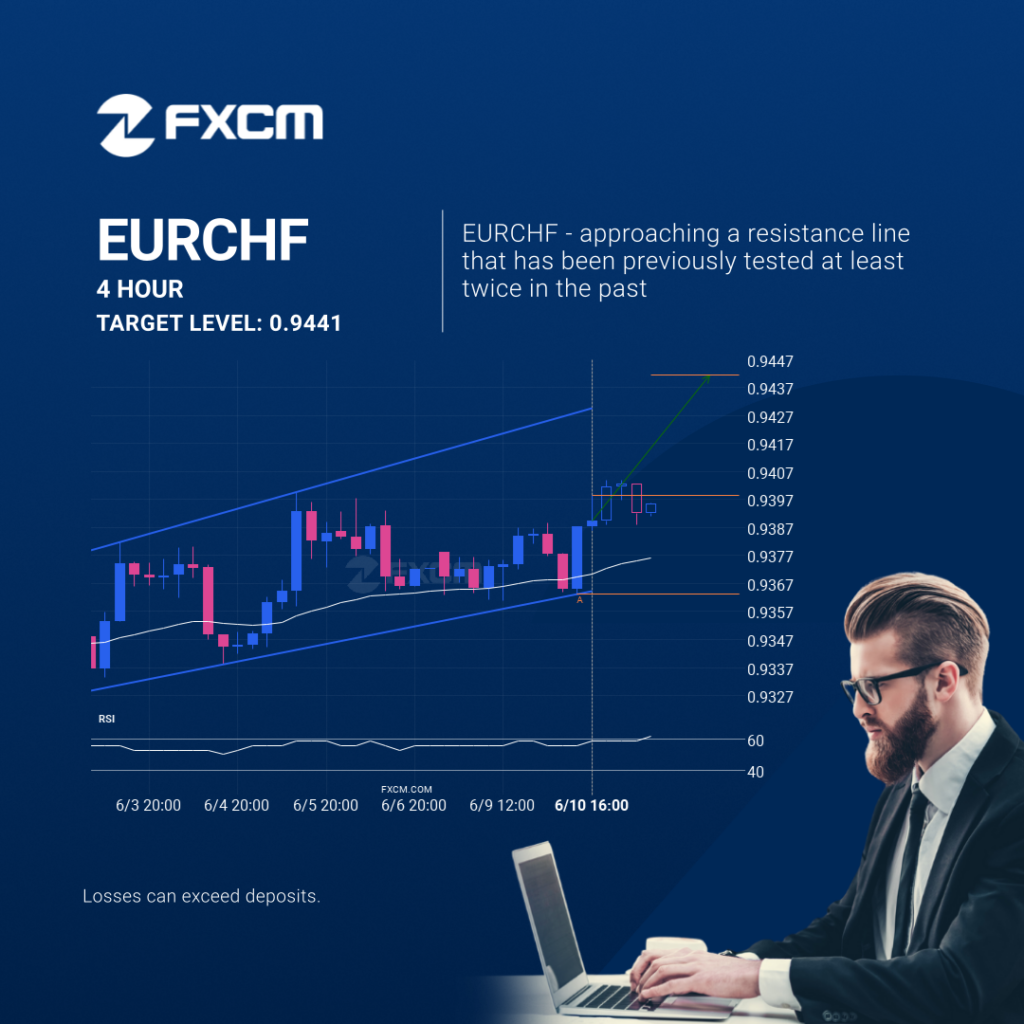
A Channel Up pattern was identified on EURCHF at 0.939855, creating an expectation that it may move to the resistance line at 0.9441. It may break through that line and continue the bullish trend or it may reverse from that line. Past performance is not an indicator of future results. Losses can exceed deposits.
EURGBP – resistance line broken at 2025-06-10T06:00:00.000Z
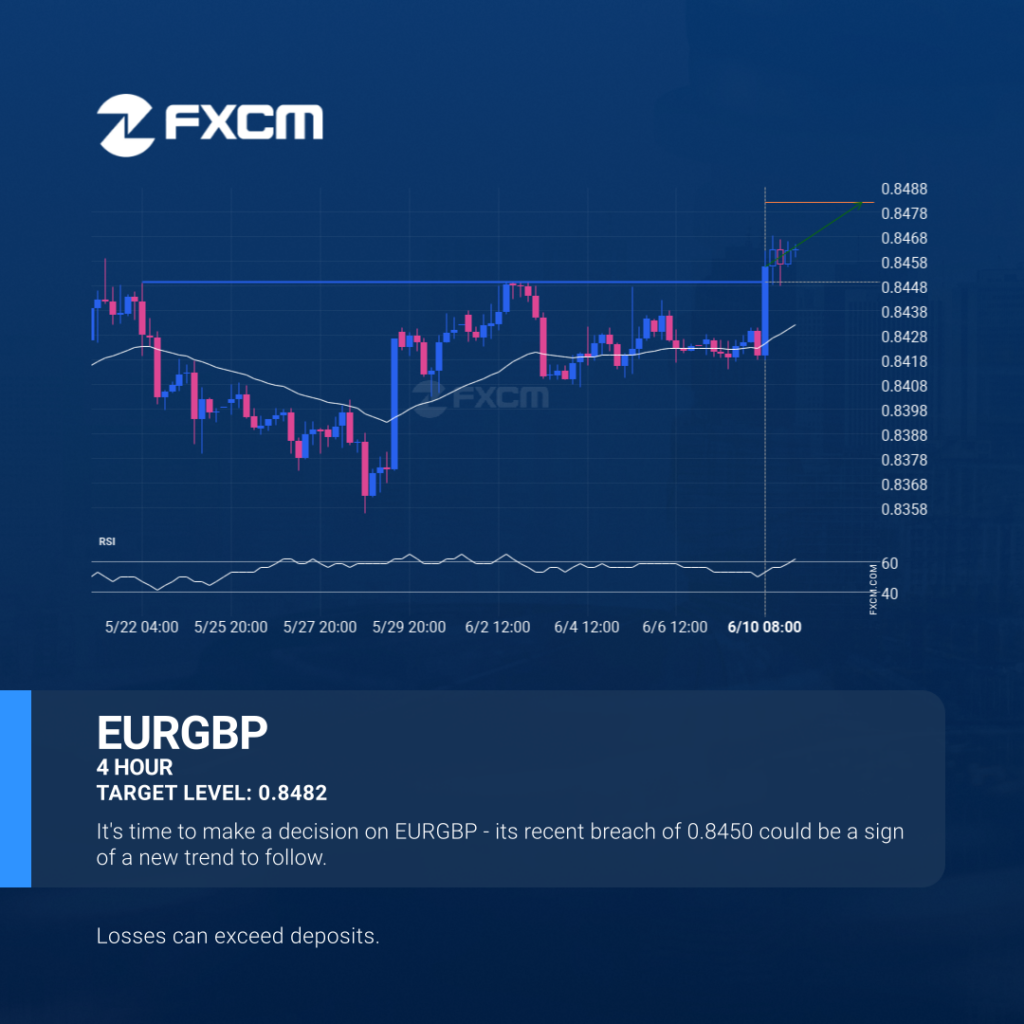
EURGBP has broken through 0.8450 which it has tested numerous times in the past. We have seen it retrace from this price in the past. If this new trend persists, EURGBP may be heading towards 0.8482 within the next 3 days. Past performance is not an indicator of future results. Losses can exceed deposits.
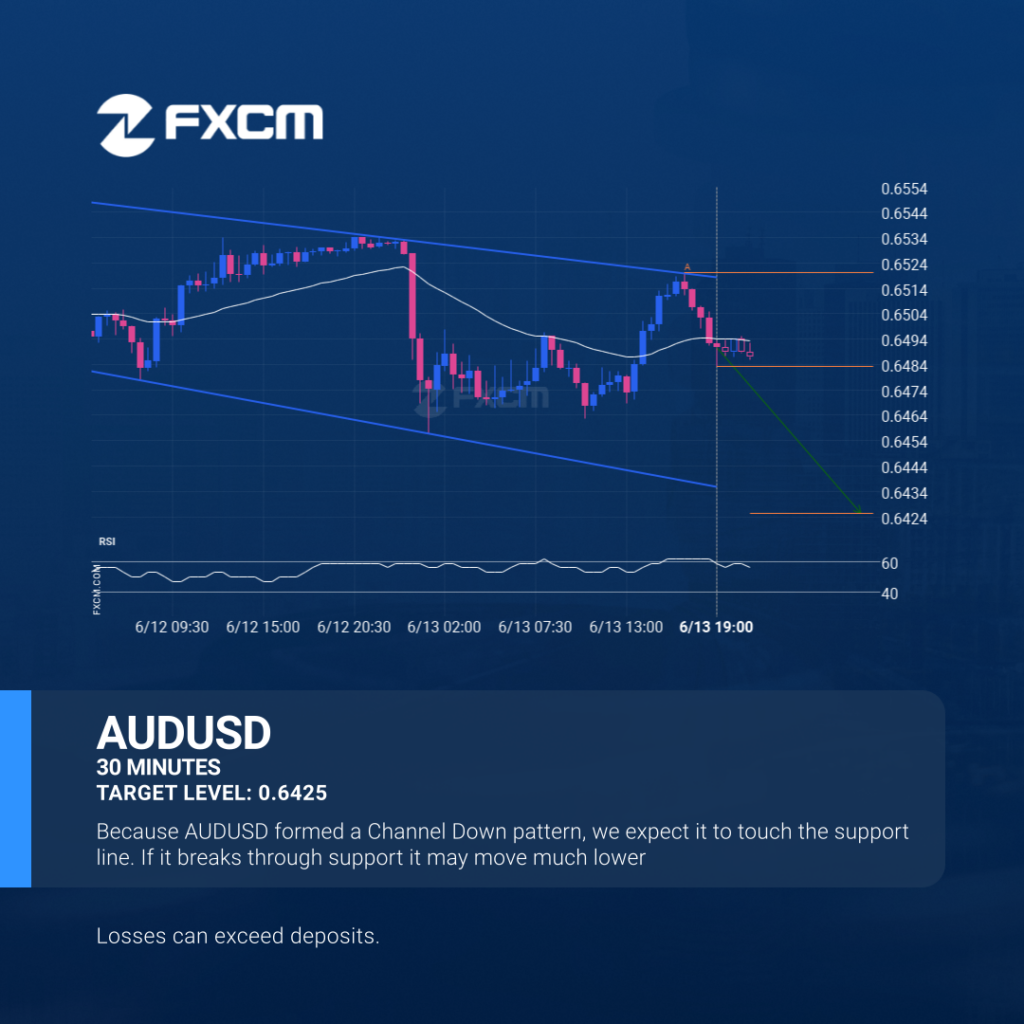
Continuation pattern on AUDUSD

AUDUSD moved through the support line of a Triangle at 0.6503866666666666 on the 1 hour chart. This line has been tested a number of times in the past and this breakout could mean an upcoming change from the current trend. It may continue in its current direction toward 0.6483. Past performance is not an indicator […]
A final push possible on GBPUSD

GBPUSD is heading towards 1.3508 and could reach this point within the next 2 days. It has tested this line numerous times in the past, and this time could be no different, ending in a rebound instead of a breakout. If the breakout doesn’t happen, we could see a retracement back down to current levels. […]