Extreme movement on GBPUSD
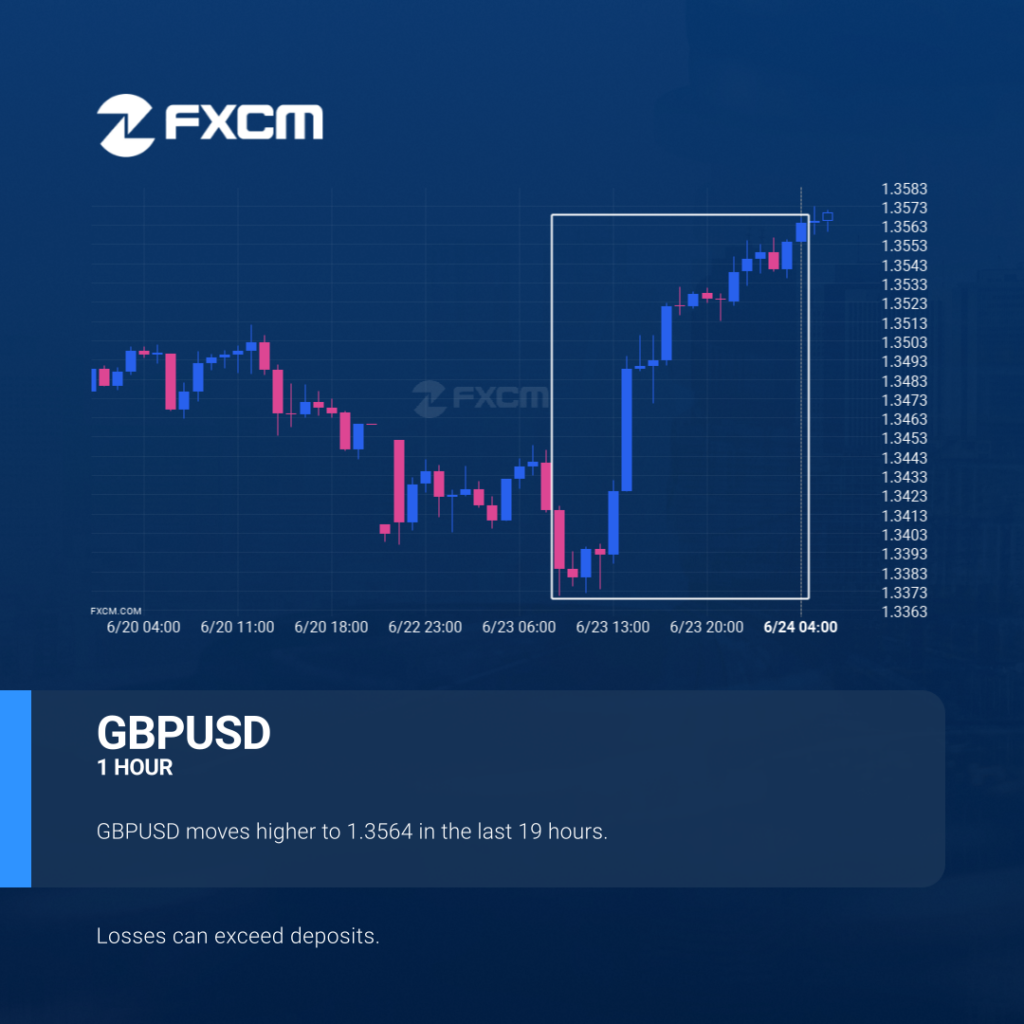
GBPUSD experienced an extremely large move that lasted 19. This movement is in the 98.0 percentile and is uncommon. It is not unusual to witness a pullback after such a big movement. Past performance is not an indicator of future results. Losses can exceed deposits.
Possible start of a bullish trend as EURCHF breaks resistance

EURCHF has broken through a line of 0.9411. If this breakout holds true, we could see the price of EURCHF heading towards 0.9435 within the next 2 days. But don’t be so quick to trade, it has tested this line numerous times in the past, so you should probably confirm the breakout before placing any […]
Is NZDUSD likely to correct after this massive movement?
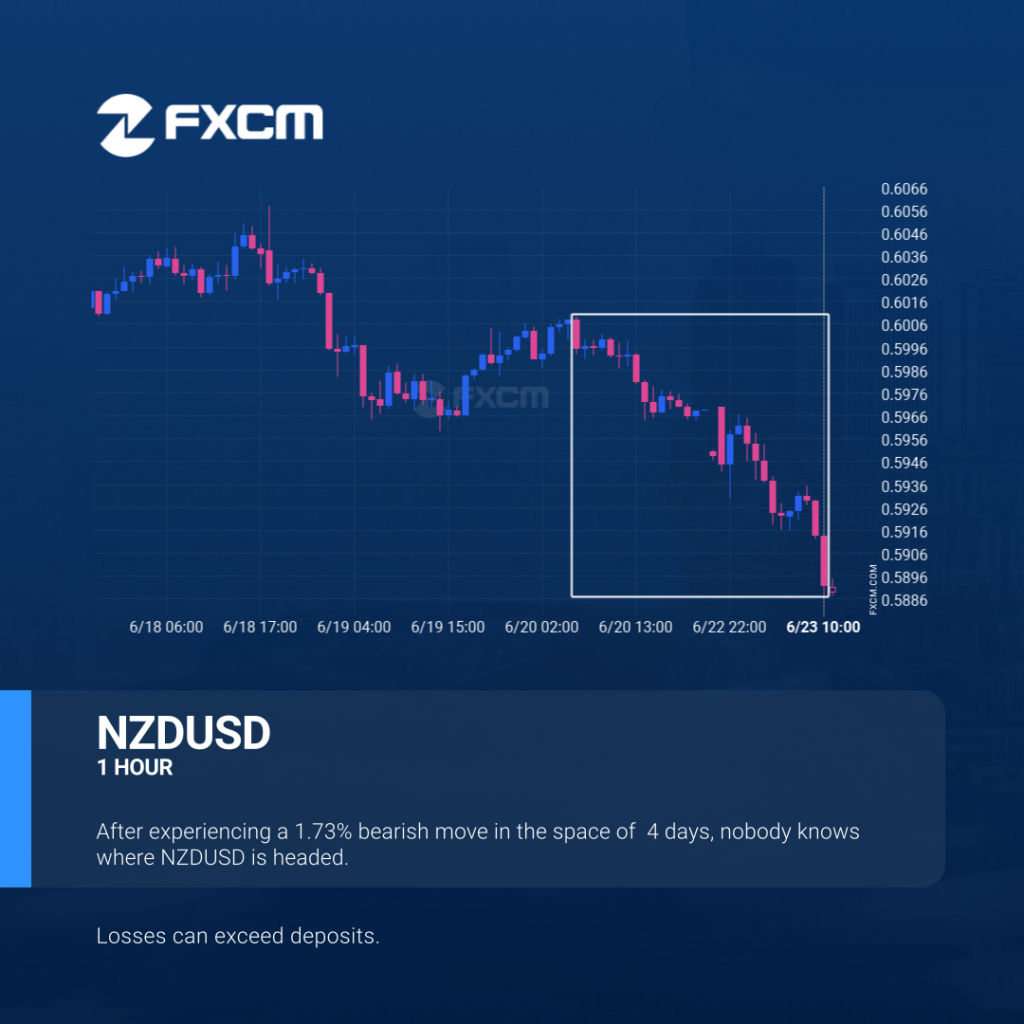
NZDUSD hits 0.58912 after a 1.73% move spanning 4 days. Past performance is not an indicator of future results. Losses can exceed deposits.
EURGBP – Continuation Chart Pattern – Channel Up

EURGBP was identified at around 0.85679 having recently rebounded of the support on the 4 hour data interval. Ultimately, the price action of the stock has formed a Channel Up pattern. This squeeze may increases the chances of a strong breakout. The projected movement will potentially take the price to around the 0.8668 level. Past […]
GBPUSD – getting close to support of a Falling Wedge

An emerging Falling Wedge has been detected on GBPUSD on the 4 hour chart. There is a possible move towards 1.3346 next few candles. Once reaching resistance it may continue its bearish run or reverse back to current price levels. Past performance is not an indicator of future results. Losses can exceed deposits.
A potential bullish movement on EURJPY

Emerging Rising Wedge pattern in its final wave was identified on the EURJPY 30 Minutes chart. After a strong bullish run, we find EURJPY heading towards the upper triangle line with a possible resistance at 167.9265. If the resistance shows to hold, the Rising Wedge pattern suggests a rebound back towards current levels. Past performance […]
EURCHF approaching resistance level

EURCHF is en route to a very important line that will be a definite deciding factor of what is to come! We may see this trajectory continue to touch and break through 0.9424, unless it runs out of momentum and pulls back to current levels. Past performance is not an indicator of future results. Losses […]
USDJPY trade outlook at 2025-06-19T10:00:00.000Z until 2025-06-19T10:00:00.000Z

USDJPY has broken through the resistance line which it has tested twice in the past. We have seen it retrace from this line before, so one should wait for confirmation of the breakout before trading. If this new trend persists, a target level of around 146.5109 may materialize within the next 2 days. Past performance […]
A potential bullish movement on EURJPY

EURJPY was identified at around 166.925 having recently rebounded of the support on the 30 Minutes data interval. Ultimately, the price action of the stock has formed a Channel Up pattern. This squeeze may increases the chances of a strong breakout. The projected movement will potentially take the price to around the 168.7940 level. Past […]
A potential bearish movement on AUDUSD
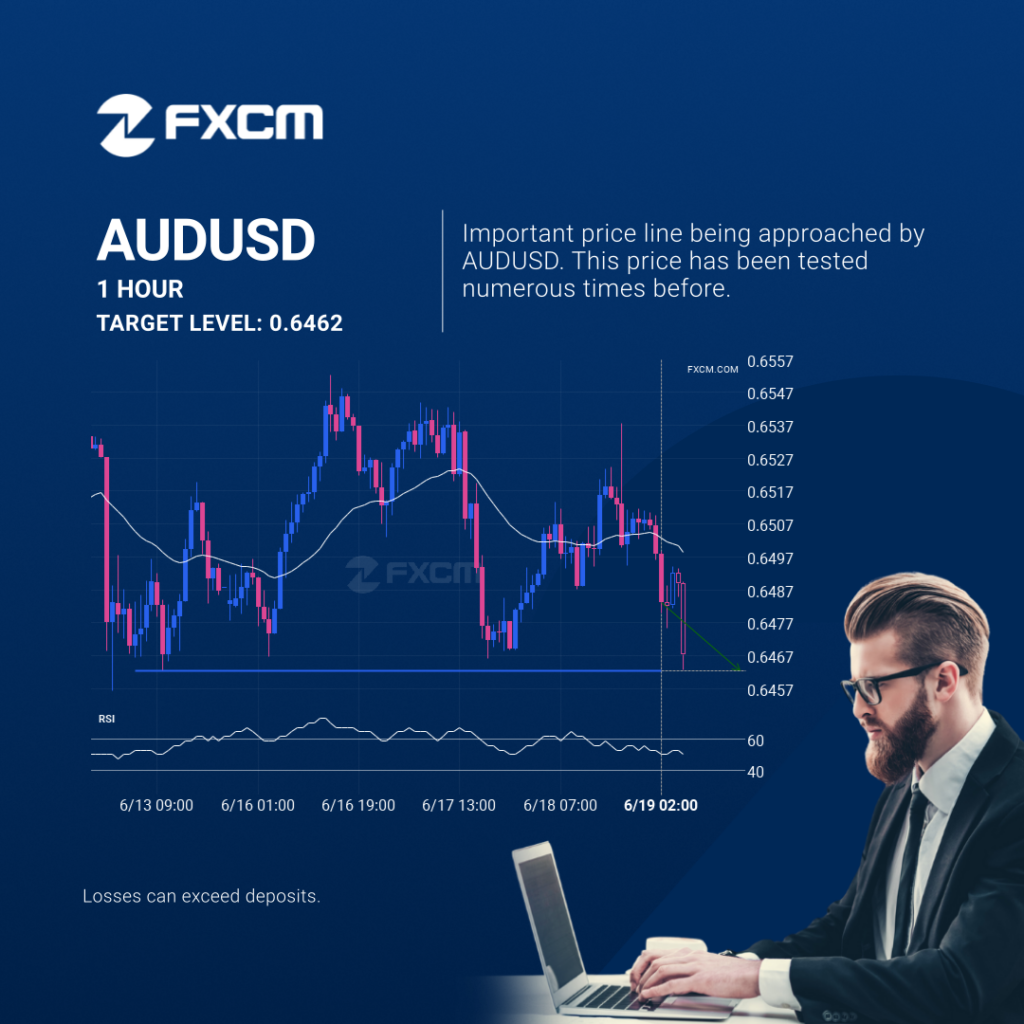
AUDUSD is moving towards a key support level at 0.6462. AUDUSD has previously tested this level 4 times and on each occasion it has bounced back off this level. Is this finally the time it will break through? Past performance is not an indicator of future results. Losses can exceed deposits.