¿Deberíamos esperar una ruptura o una recuperación del AUDUSD?
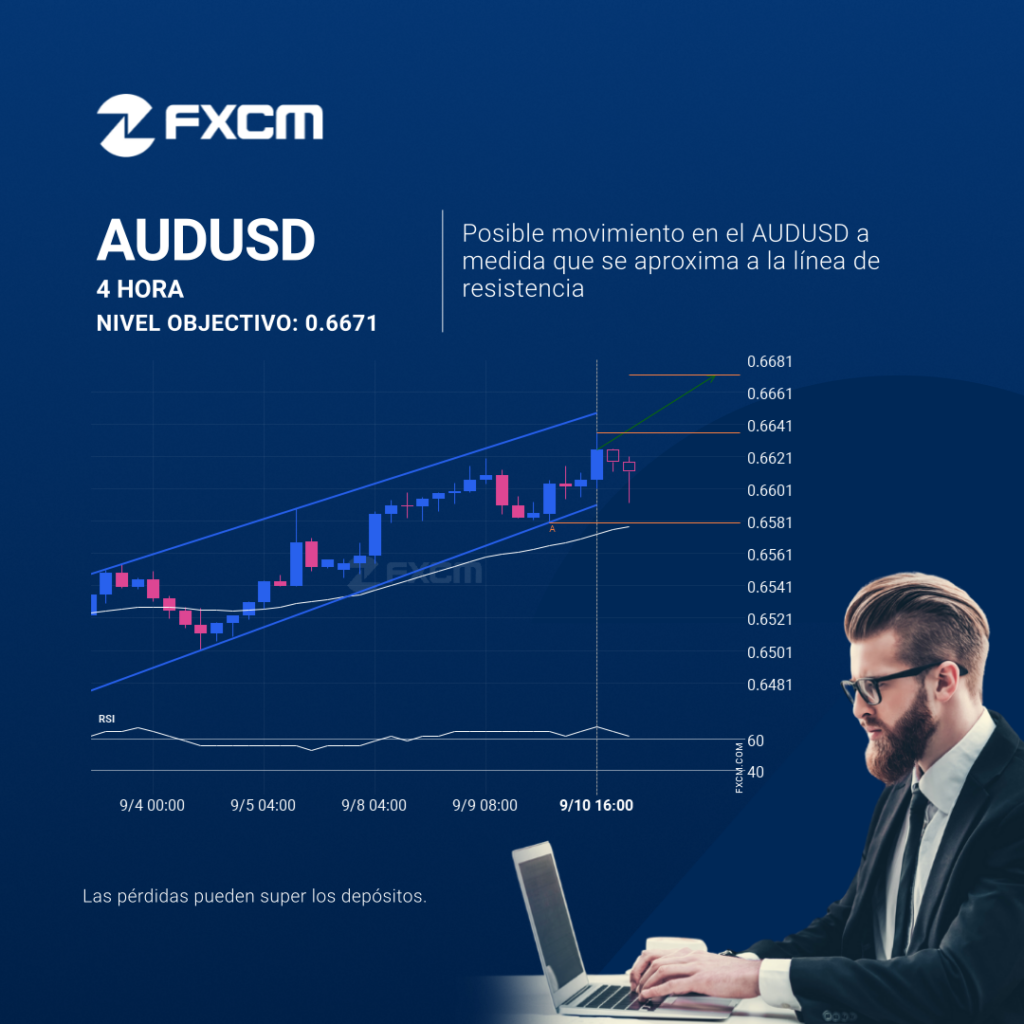
El movimiento del AUDUSD hacia la línea de resistencia de un Canal alcista es otra prueba más de la línea que ha alcanzado en numerosas ocasiones durante el pasado. Esta prueba de la línea podría ocurrir en las próximas 2 días, pero no sabemos si dará como resultado una ruptura a través de esta línea […]
EURUSD – Continuation Chart Pattern – Channel Up
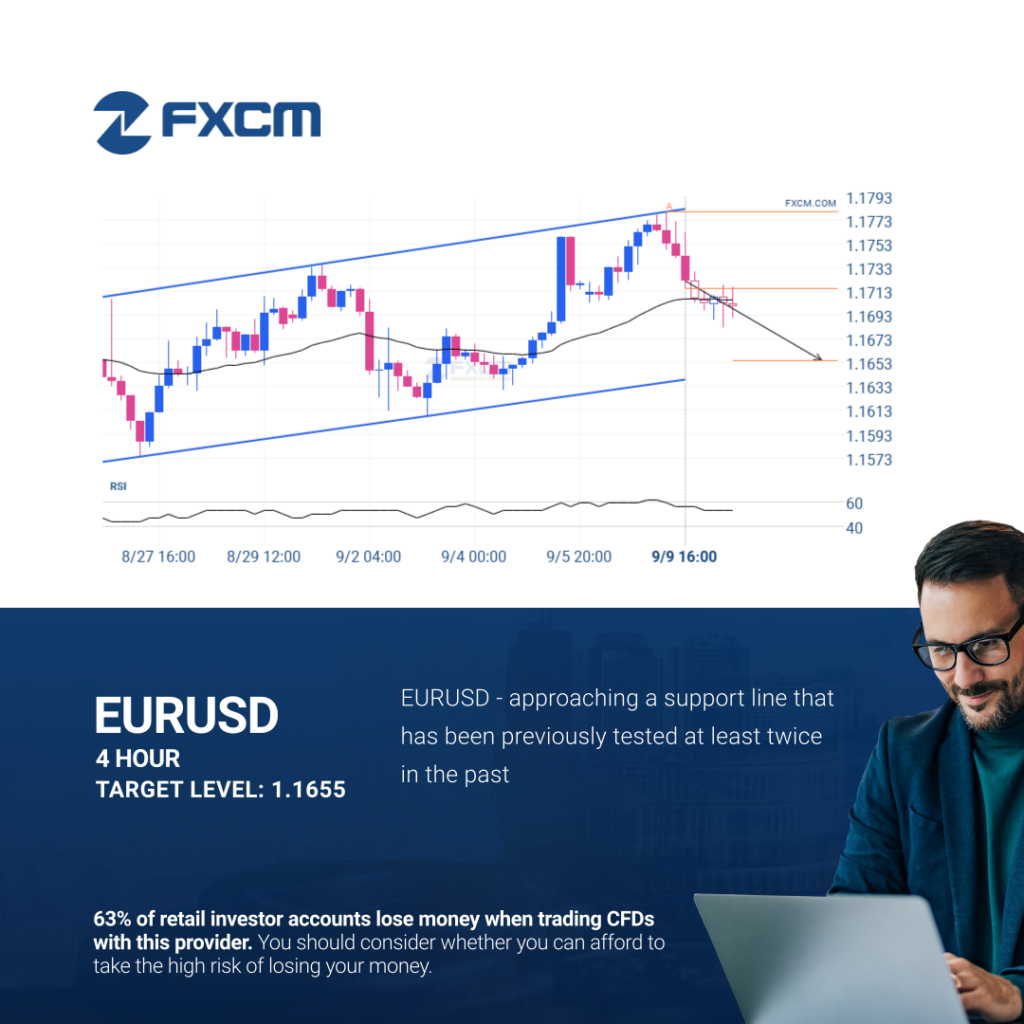
EURUSD is approaching the support line of a Channel Up. It has touched this line numerous times in the last 19 days. If it tests this line again, it should do so in the next 3 days. Past performance is not an indicator of future results. Trading leveraged products carries significant risk. Please refer to […]
EURUSD – Continuation Chart Pattern – Channel Up
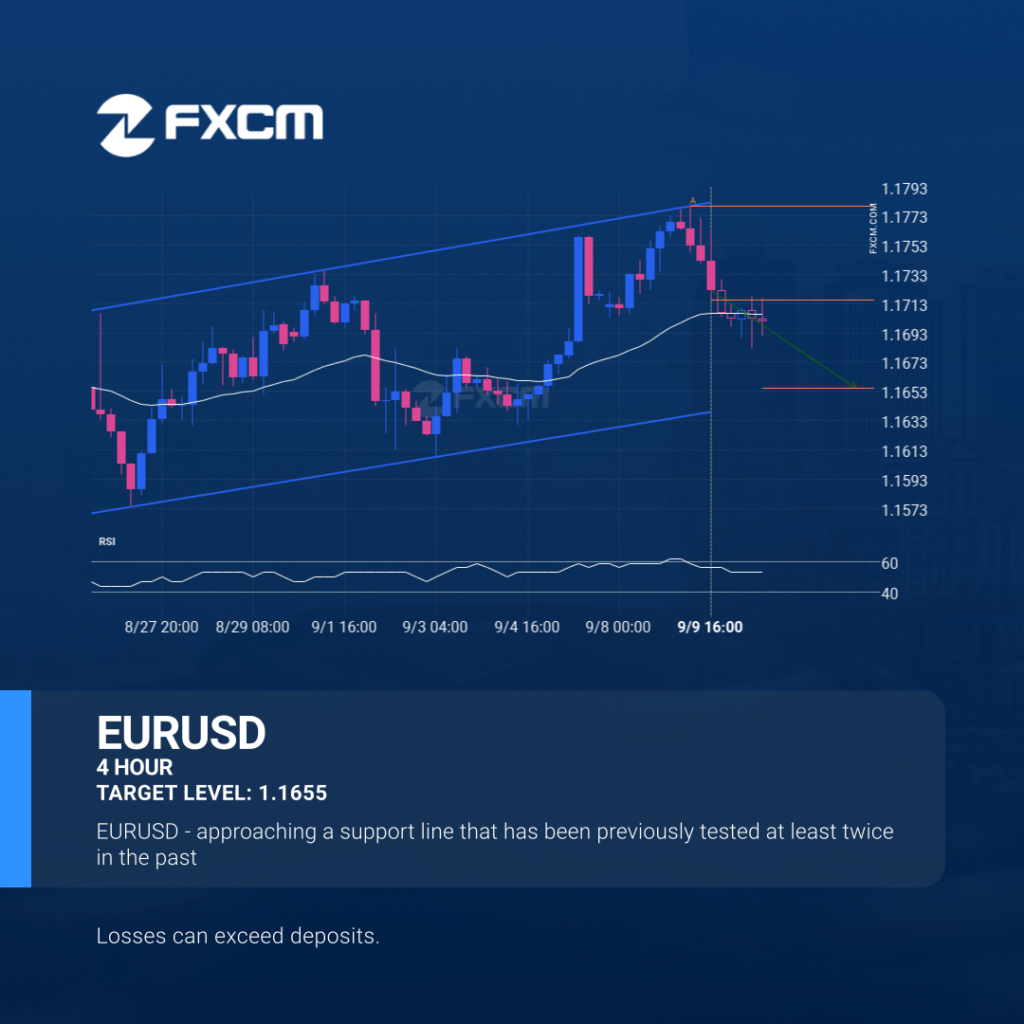
EURUSD is approaching the support line of a Channel Up. It has touched this line numerous times in the last 19 days. If it tests this line again, it should do so in the next 3 days. Past performance is not an indicator of future results. Losses can exceed deposits.
EURUSD – Continuation Patrón de gráfico – Canal alcista
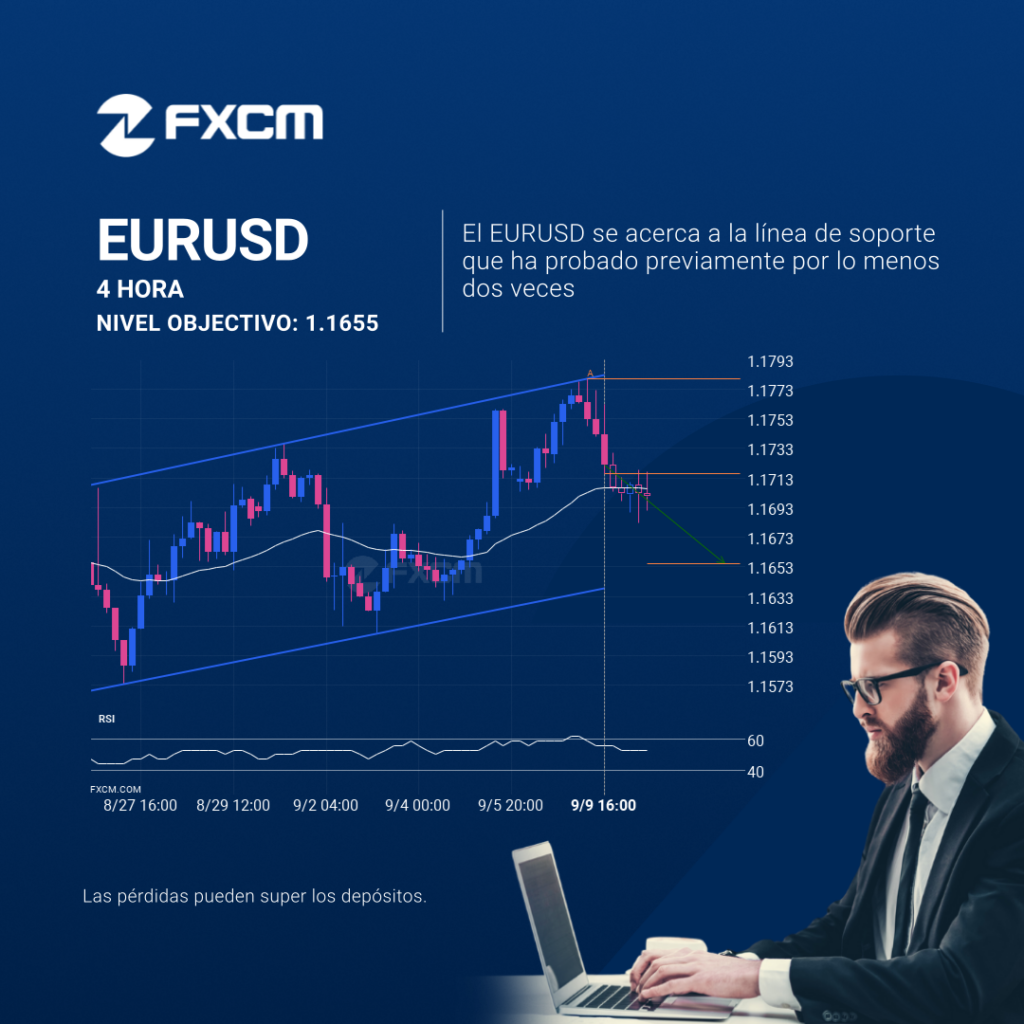
El EURUSD se está acercando a la línea de soporte de un Canal alcista. Ha llegado a esta línea en numerosas ocasiones durante los últimos 19 días. Si vuelve a probarla de nuevo, debería hacerlo en las próximas 3 días. El rendimiento pasado no es indicativo de resultados futuros. Las pérdidas pueden exceder los fondos […]
Rotura de Cuña ascendente en EURJPY

EURJPY atravesó la línea de soporte de un patrón de Cuña ascendente en 172.93117647058824 en el gráfico de 4 Hora. Esta línea se ha testeado varias veces en el pasado y esta rotura podría significar un próximo cambio de la tendencia actual. Puede continuar en su dirección actual hacia 171.4444. El rendimiento pasado no es […]
Rising Wedge breakout on EURJPY
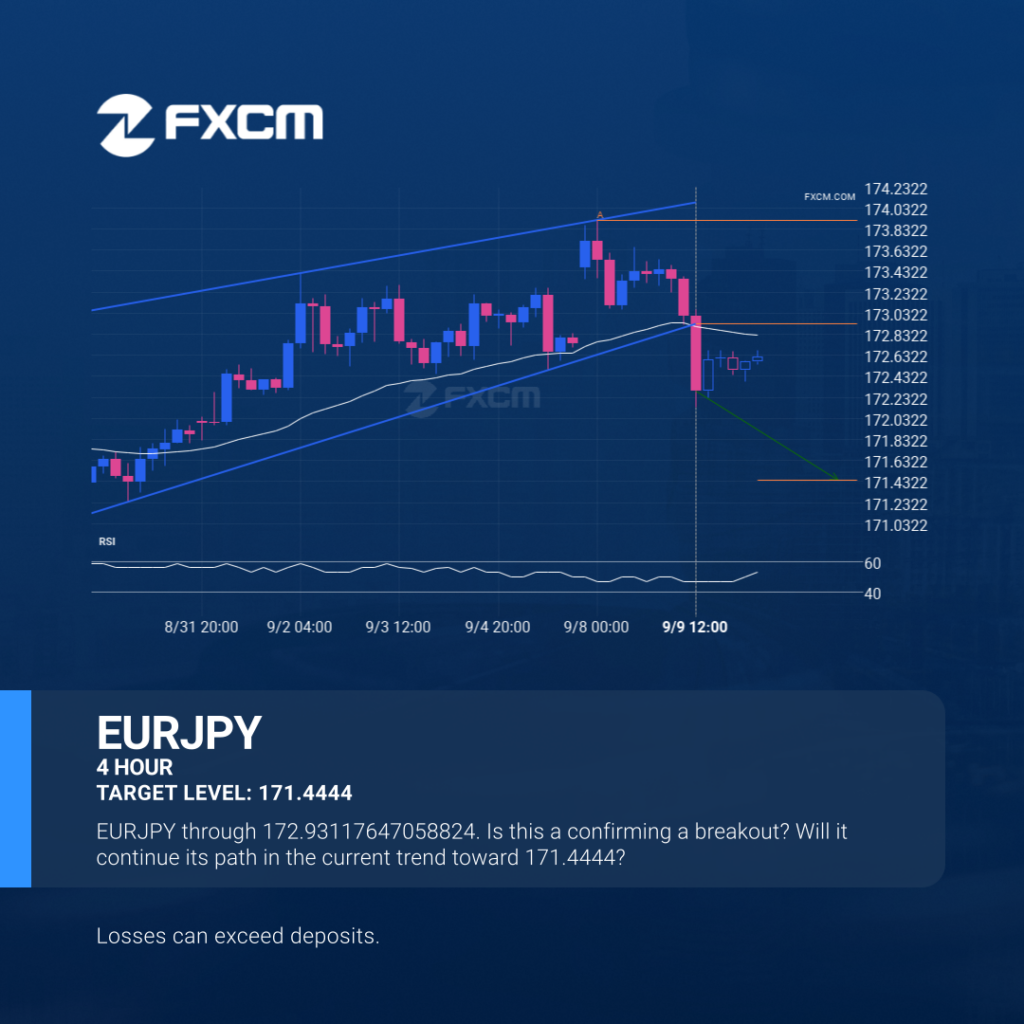
EURJPY moved through the support line of a Rising Wedge at 172.93117647058824 on the 4 hour chart. This line has been tested a number of times in the past and this breakout could mean an upcoming change from the current trend. It may continue in its current direction toward 171.4444. Past performance is not an […]
BTCUSD – se acerca a la línea de precio psicológico
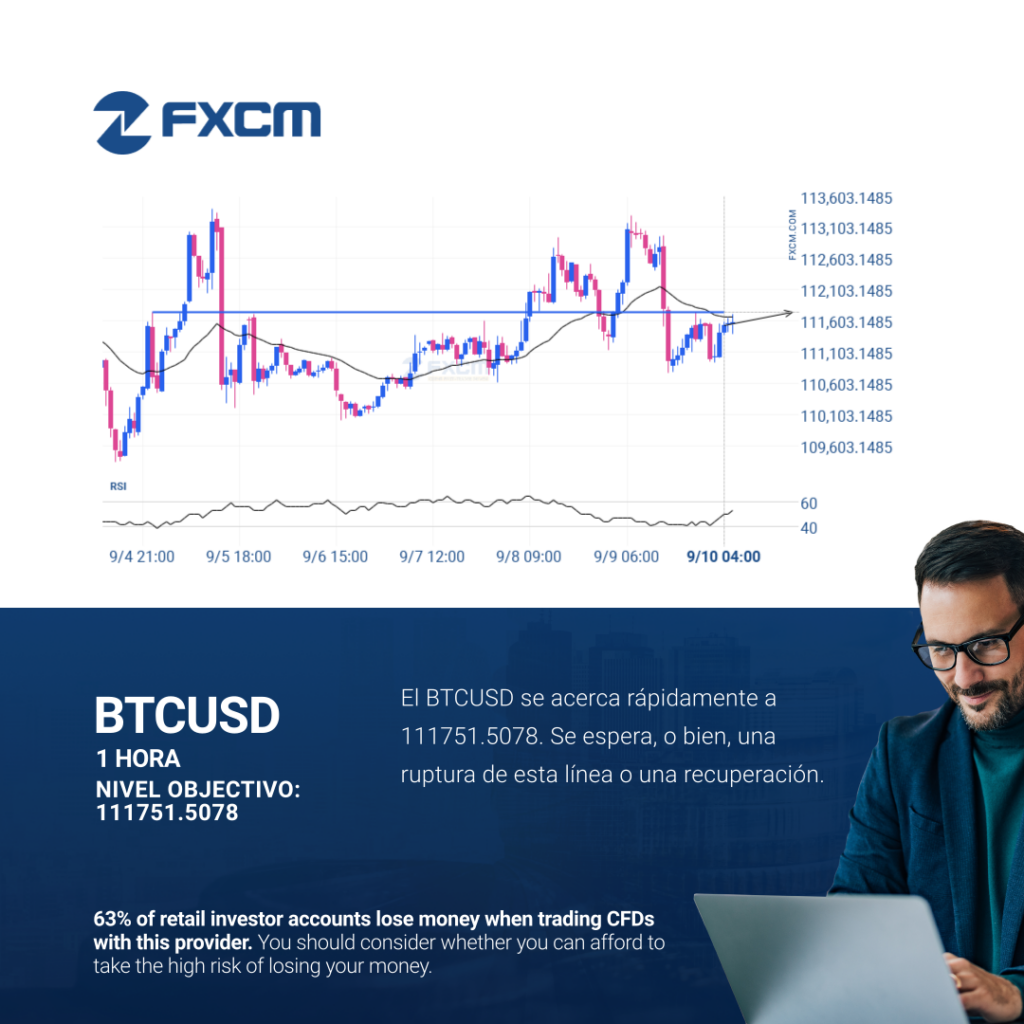
El BTCUSD avanza hacia la línea de 111751.5078. Si este movimiento se mantiene, el precio del BTCUSD podría probar el nivel de 111751.5078 en un plazo de 2 días. Pero no se apresure a la hora de operar, porque el par ha probado esta línea en numerosas ocasiones durante el pasado, por lo que este […]
ESP35: línea de resistencia rota a las 2025-09-09T17:00:00.000Z
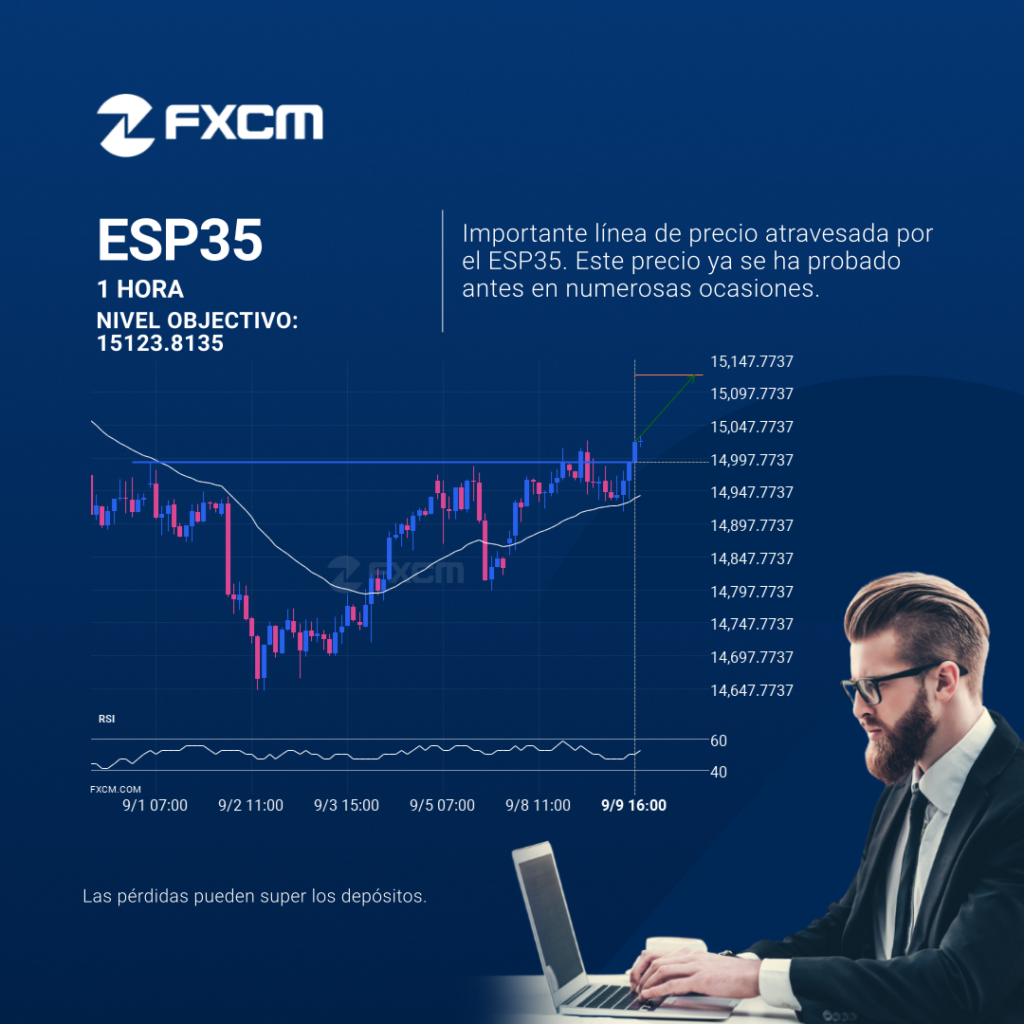
El ESP35 ha atravesado 14990.8203, que ha probado ya varias veces en el pasado. Ya hemos visto un retroceso de esta posición en numerosas ocasiones. Si esta nueva tendencia persiste, ESP35 podría dirigirse al nivel 15123.8135 dentro de las próximas 19 horas. El rendimiento pasado no es indicativo de resultados futuros. Las pérdidas pueden exceder […]
ESP35 – resistance line broken at 2025-09-09T17:00:00.000Z
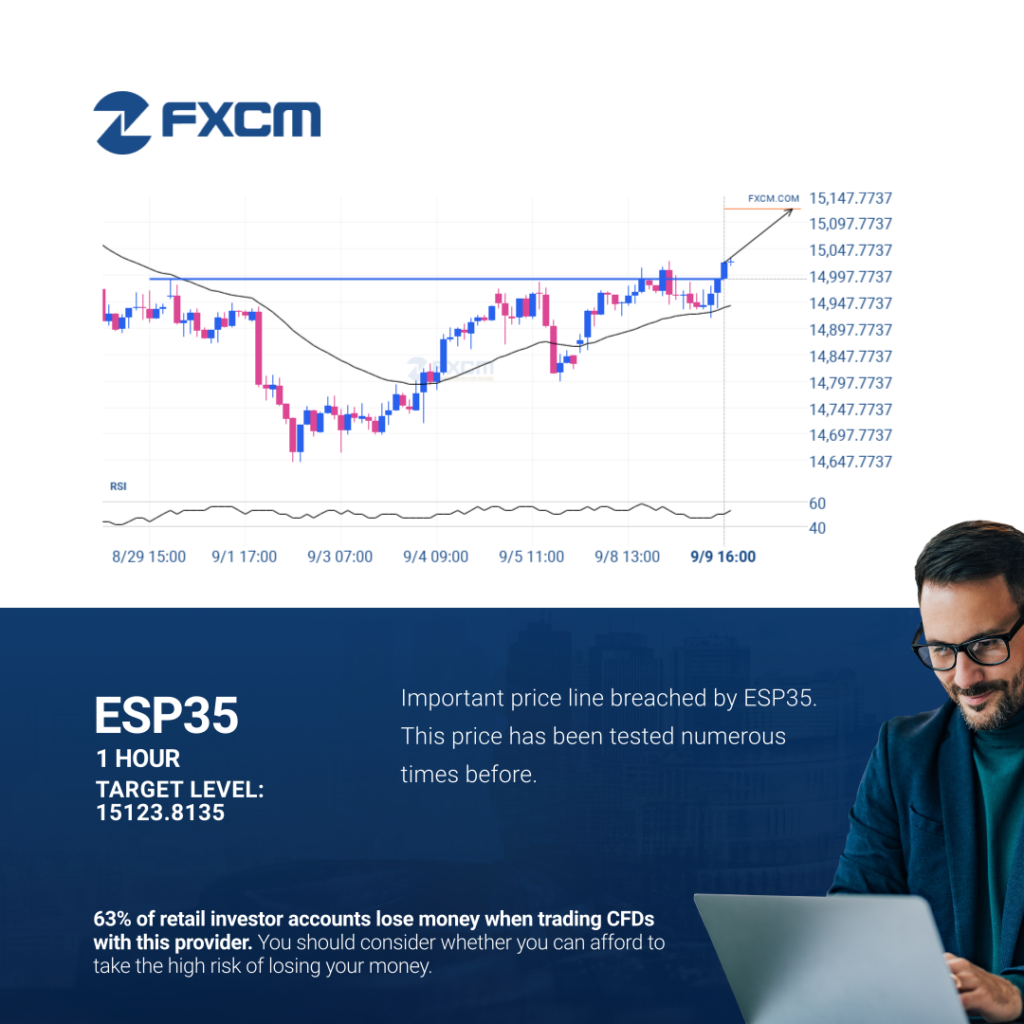
ESP35 has broken through 14990.8203 which it has tested numerous times in the past. We have seen it retrace from this price in the past. If this new trend persists, ESP35 may be heading towards 15123.8135 within the next 19 hours. Past performance is not an indicator of future results. Trading leveraged products carries significant […]
A potential bullish movement on USDJPY
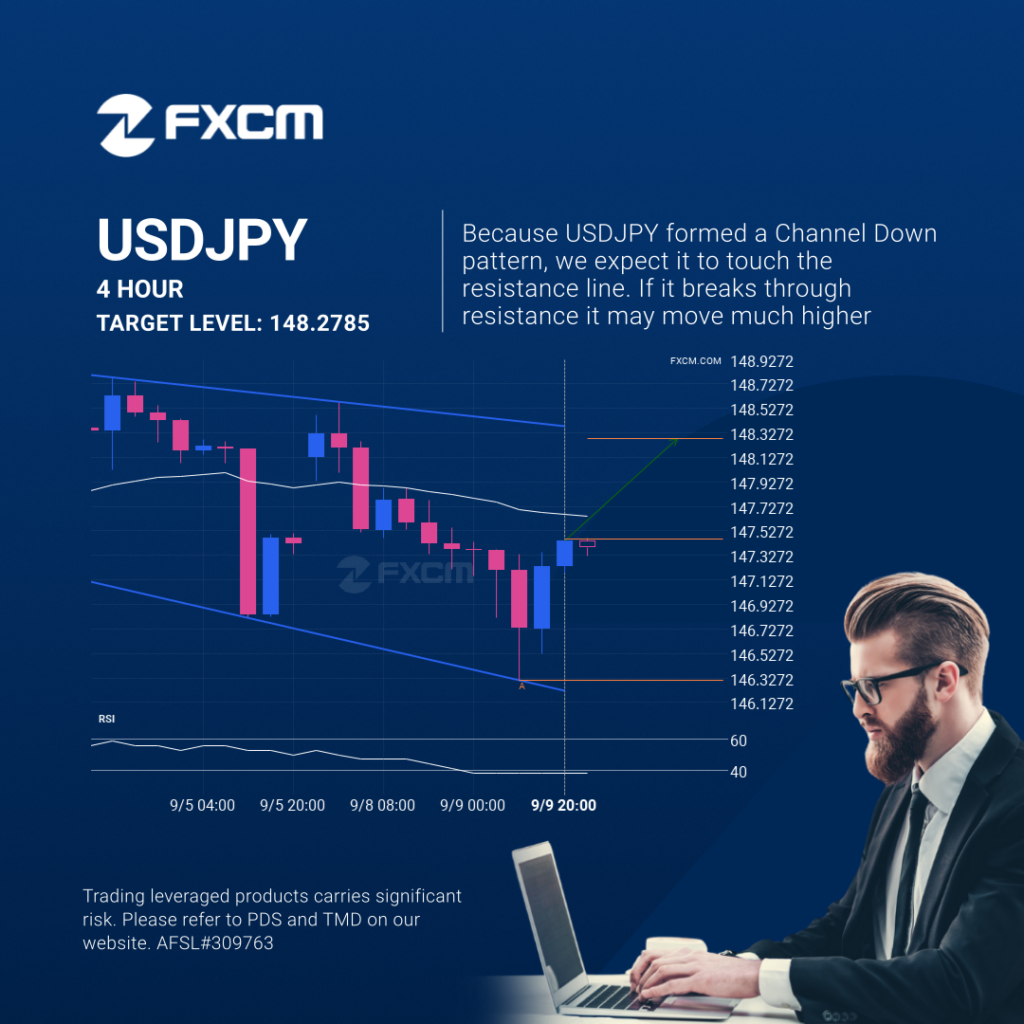
USDJPY is moving towards a resistance line which it has tested numerous times in the past. We have seen it retrace from this line before, so at this stage it isn’t clear whether it will breach this line or rebound as it did before. If USDJPY continues in its current trajectory, we could see it […]