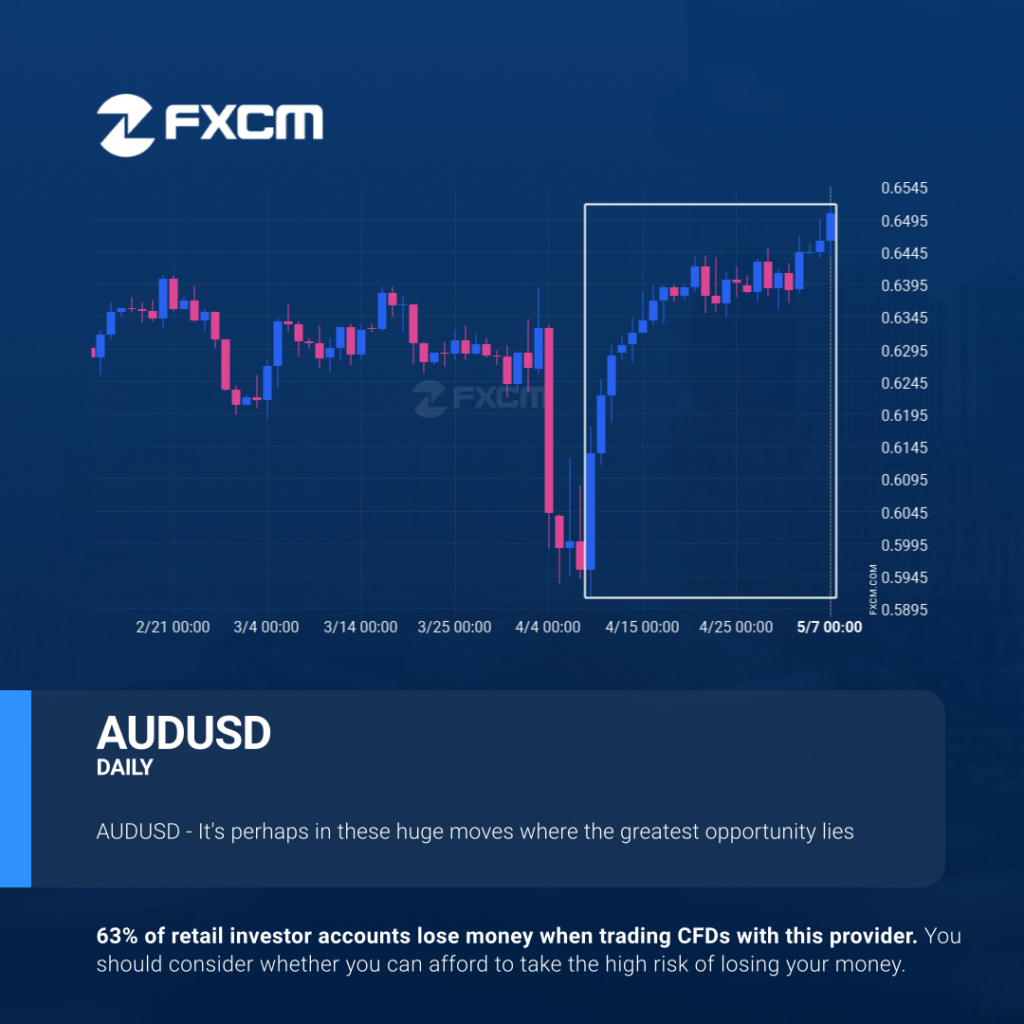
AUDUSD was on its way up

AUDUSD hits 0.650335 after a 6.03% move spanning 29 days. Past performance is not an indicator of future results. Trading leveraged products carries significant risk. Please refer to PDS and TMD on our website. AFSL#309763
AUDUSD was on its way up
AUDUSD hits 0.650335 after a 6.03% move spanning 29 days. Past performance is not an indicator of future results. Trading leveraged products carries significant risk. Please refer to PDS and TMD on our website. AFSL#309763
AUDUSD was on its way up
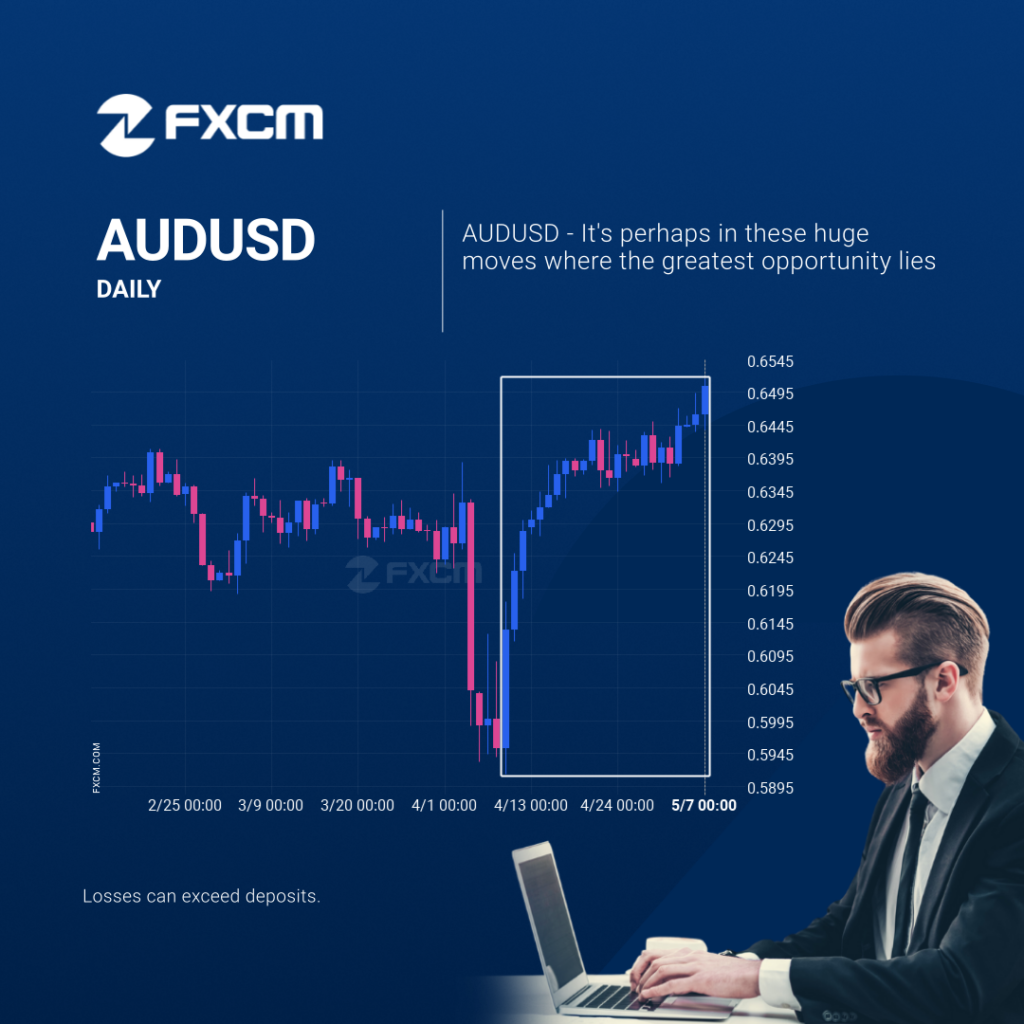
AUDUSD hits 0.650335 after a 6.03% move spanning 29 days. Past performance is not an indicator of future results. Losses can exceed deposits.
AUDUSD fue hacia arriba
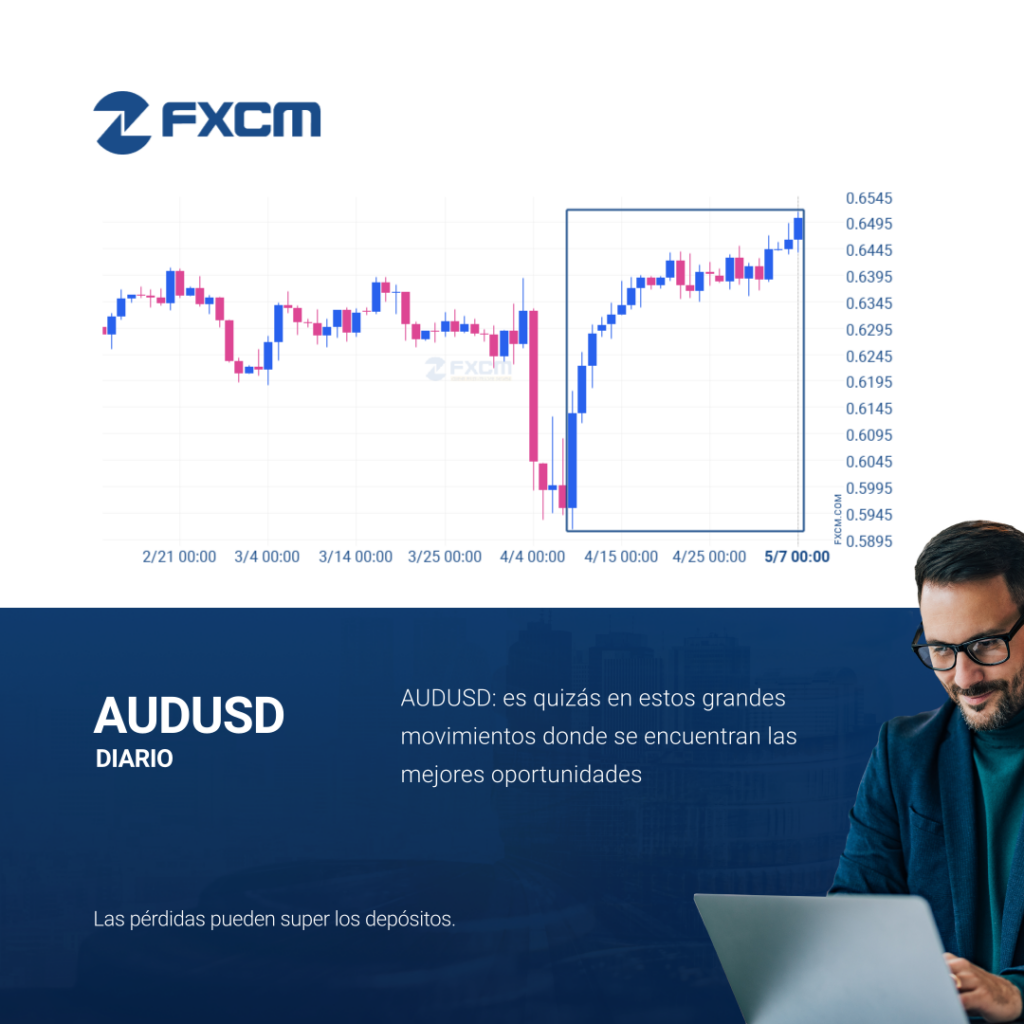
AUDUSD llegó a 0.650335 después de un movimiento del 6,03% que ha durado 29 días. El rendimiento pasado no es indicativo de resultados futuros. Las pérdidas pueden exceder los fondos depositados.
BTCUSD: plan para operación alcista a corto plazo hasta 97720.0234
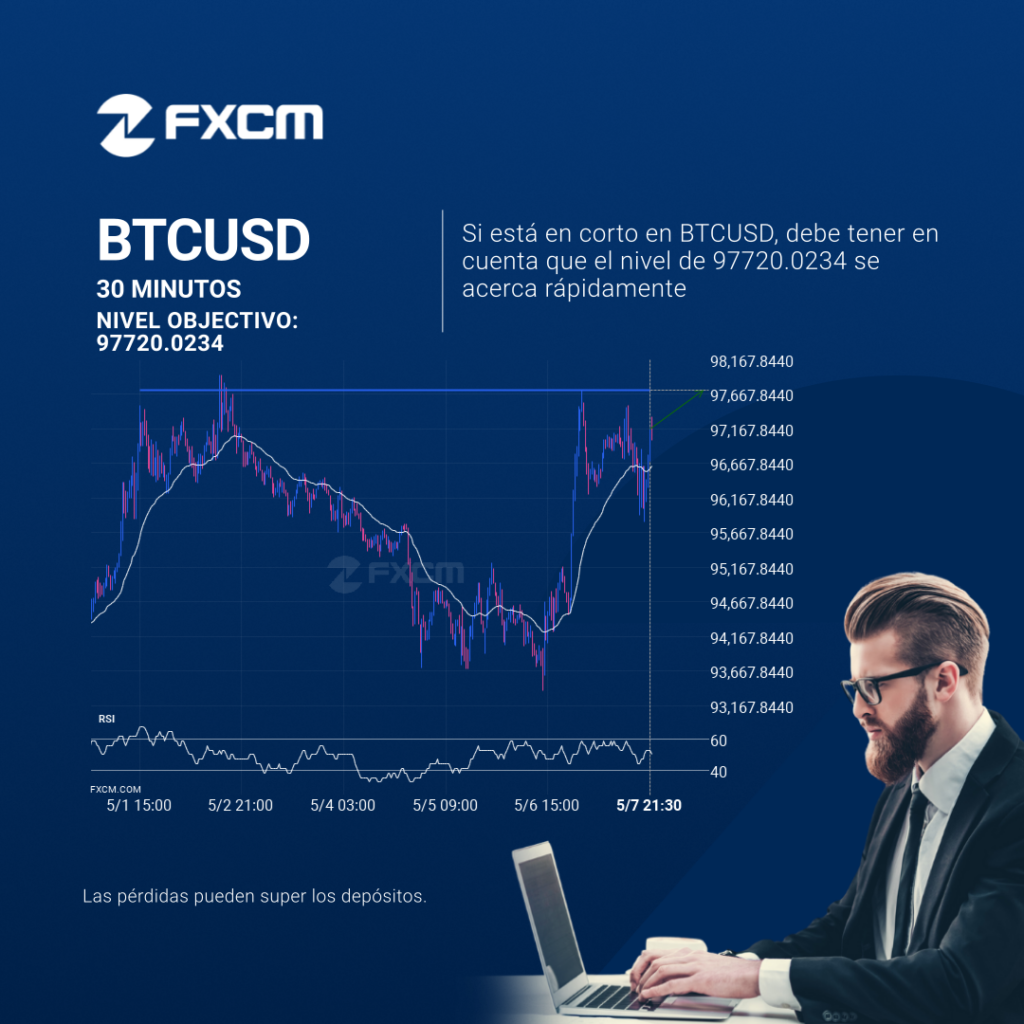
El BTCUSD avanza hacia la línea de 97720.0234. Si este movimiento se mantiene, el precio del BTCUSD podría probar el nivel de 97720.0234 en un plazo de 2 días. Pero no se apresure a la hora de operar, porque el par ha probado esta línea en numerosas ocasiones durante el pasado, por lo que este […]
Channel Down breakout on USDJPY
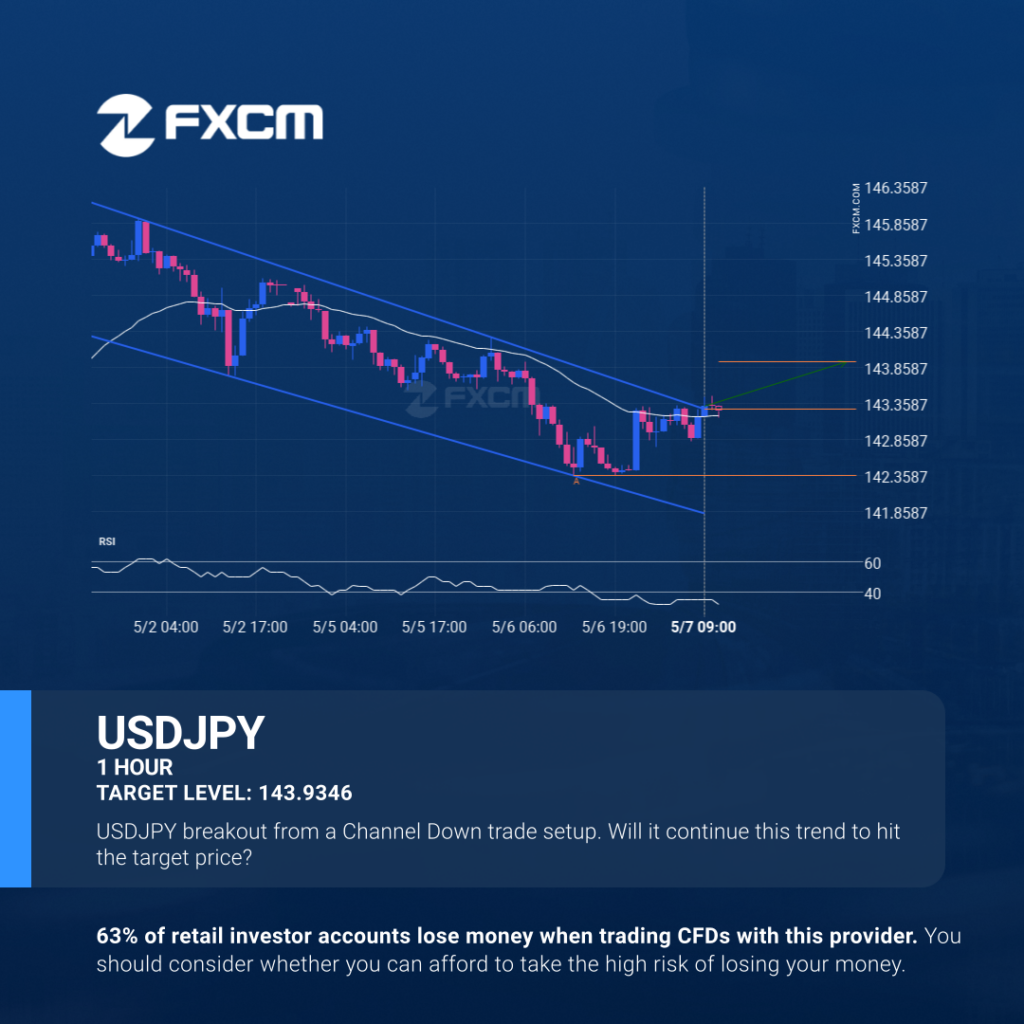
Channel Down pattern identified on USDJPY has broken through a resistance level with the price momentum continuing to move in an upward direction. A solid trading opportunity continues with the price expected to reach 143.9346 in the next 2. Past performance is not an indicator of future results. Trading leveraged products carries significant risk. Please […]
Channel Down breakout on USDJPY
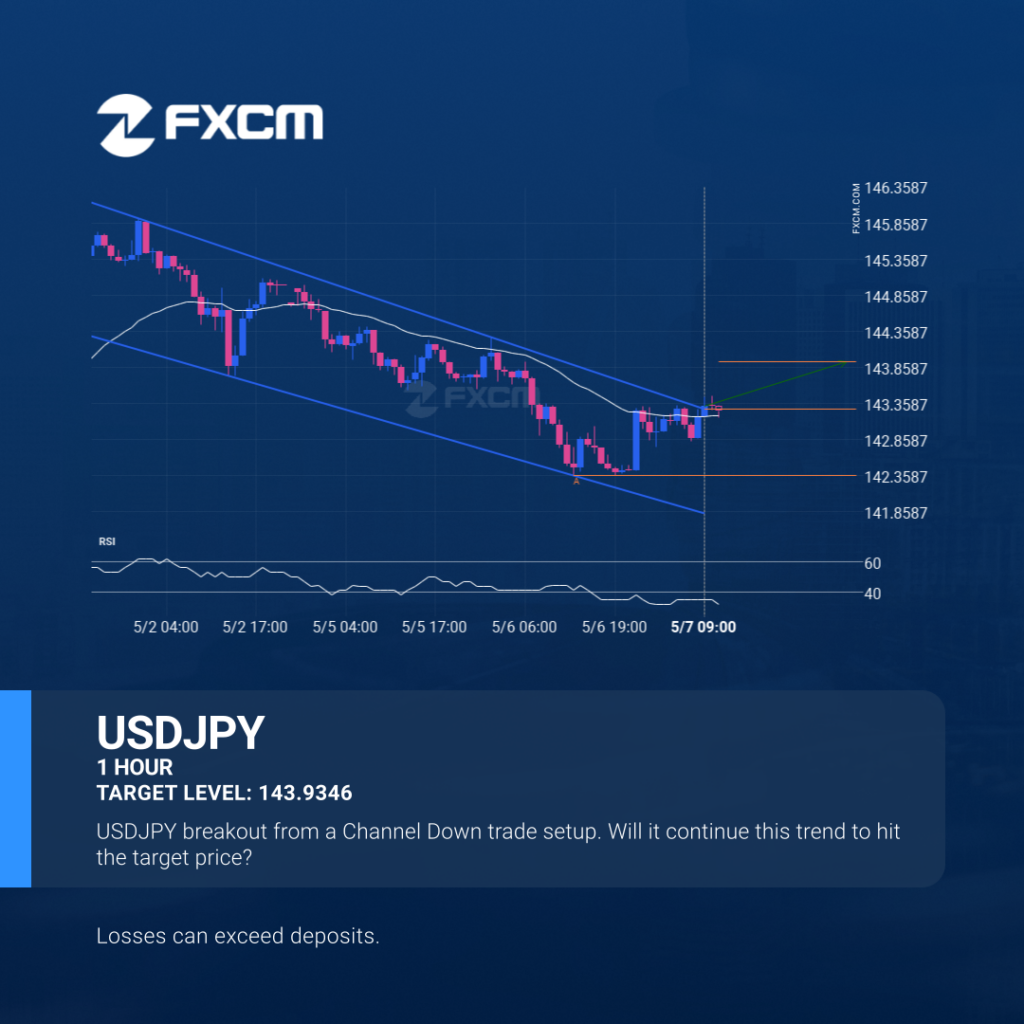
Channel Down pattern identified on USDJPY has broken through a resistance level with the price momentum continuing to move in an upward direction. A solid trading opportunity continues with the price expected to reach 143.9346 in the next 2. Past performance is not an indicator of future results. Losses can exceed deposits.
Rotura de Canal bajista en USDJPY
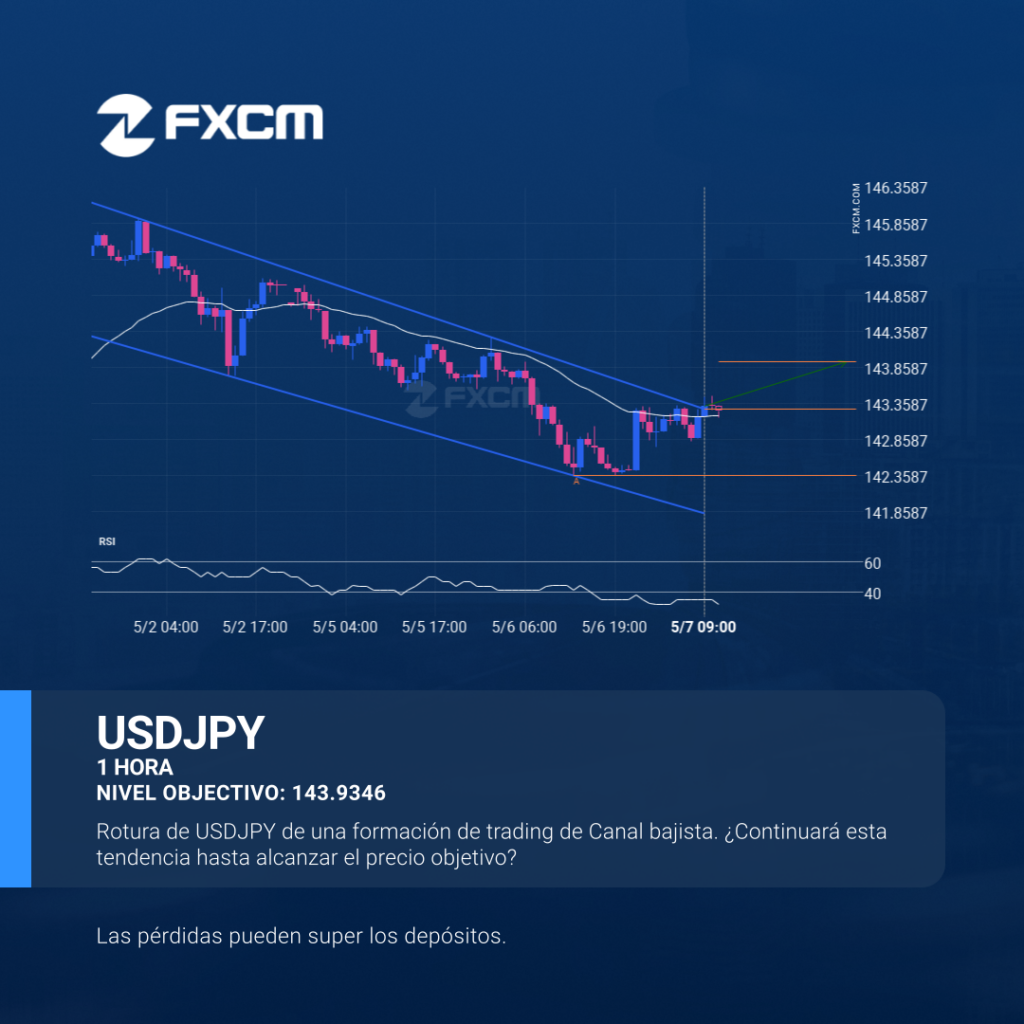
El patrón de Canal bajista identificado en USDJPY ha atravesado un nivel de resistencia y el impulso del precio continúa moviéndose en dirección alcista. Continúa siendo una buena oportunidad de trading y se espera que el precio alcance 143.9346 en un plazo de 2. El rendimiento pasado no es indicativo de resultados futuros. Las pérdidas […]
Inminente recuperación o irrupción del USDCAD
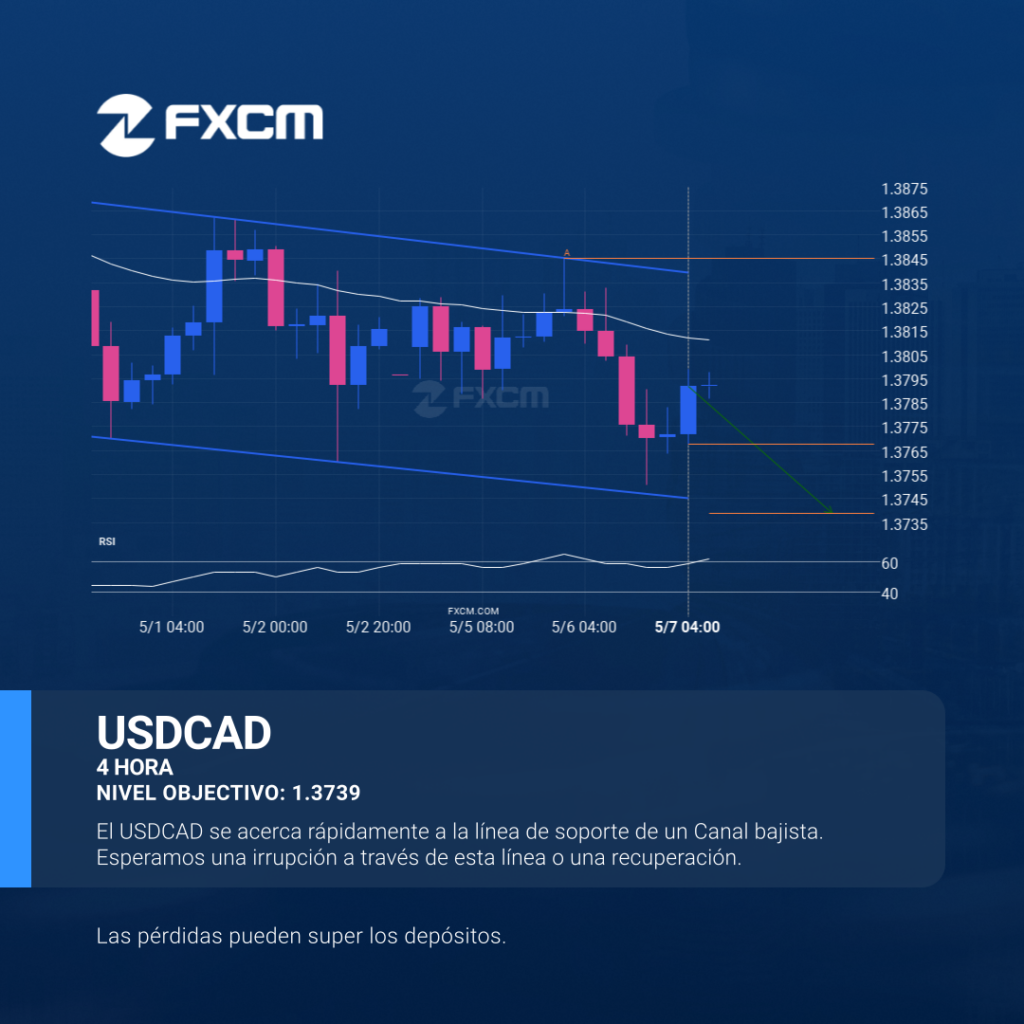
Se ha detectado un patrón Canal bajista en formación en USDCAD en el gráfico de 4 Hora. Existe la posibilidad de un movimiento hacia 1.3739 en las próximas velas. Una vez que alcance resistance, el precio puede continuar su tendencia bearish o revertir a los niveles actuales de precio. El rendimiento pasado no es indicativo […]