USDJPY – Patrón de gráfico Continuation – Bandera
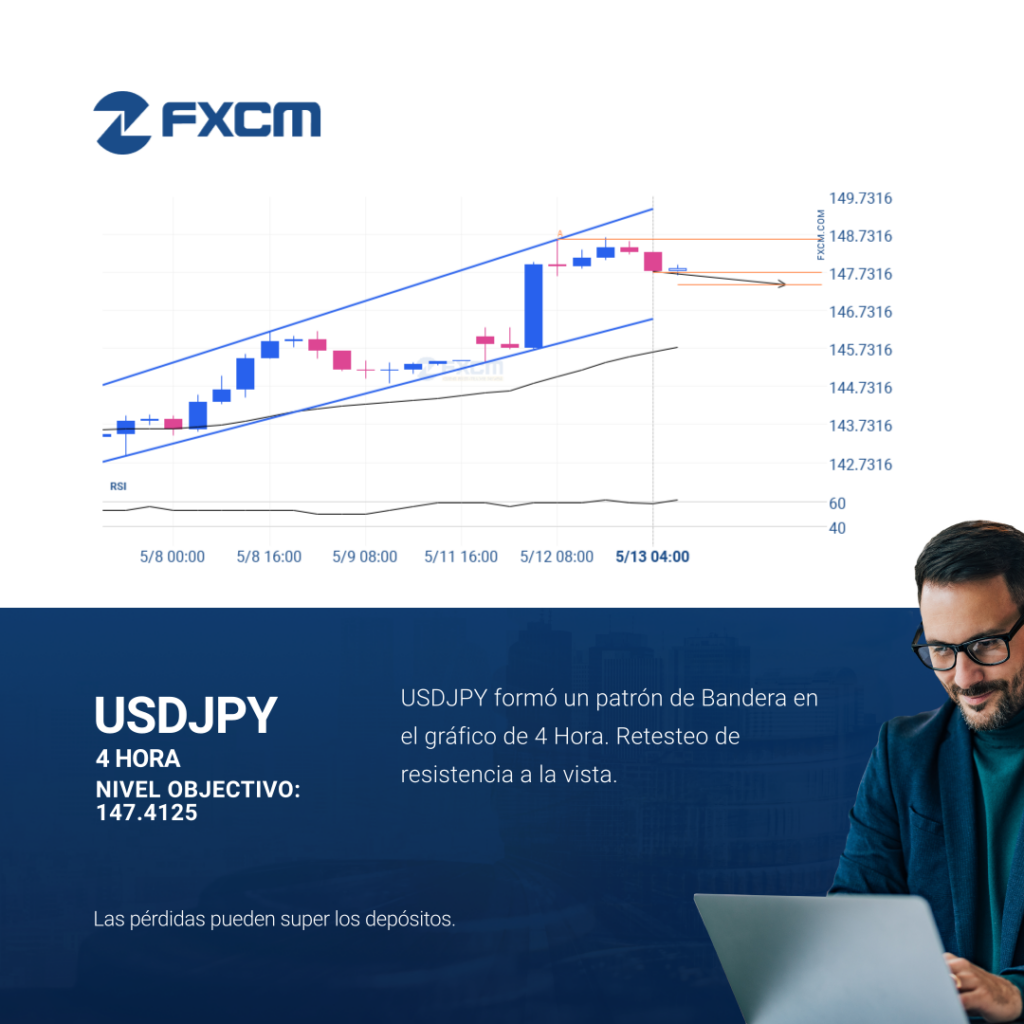
USDJPY está atrapado en una formación de Bandera, lo que implica que una rotura es inminente. Esta es una excelente configuración de trading tanto para los operadores de tendencia como para los de swing. Ahora se está acercando a una línea de resistencia que se testeó en el pasado. Los oportunistas de la divergencia pueden […]
A final push possible on HKG33
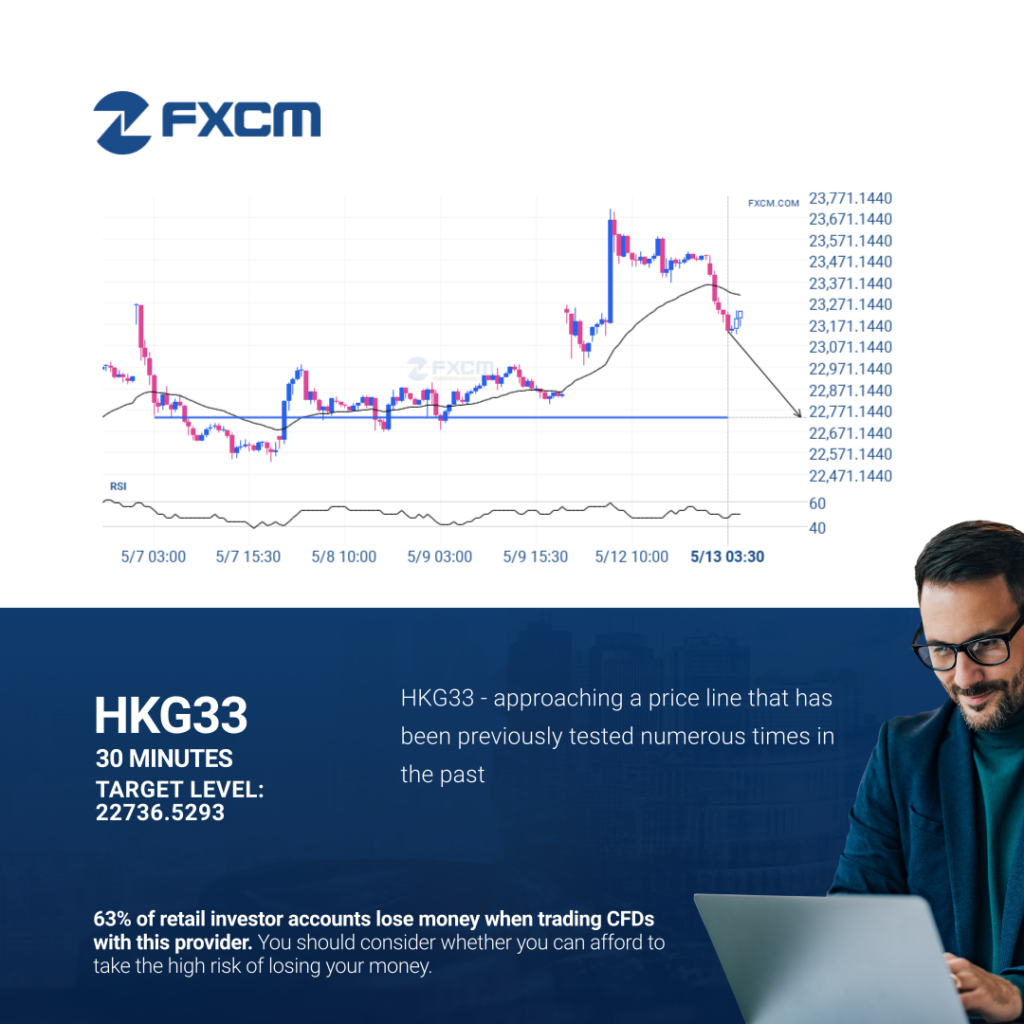
A strong support level has been identified at 22736.5293 on the 30 Minutes HKG33 chart. HKG33 is likely to test it soon. Past performance is not an indicator of future results. Trading leveraged products carries significant risk. Please refer to PDS and TMD on our website. AFSL#309763
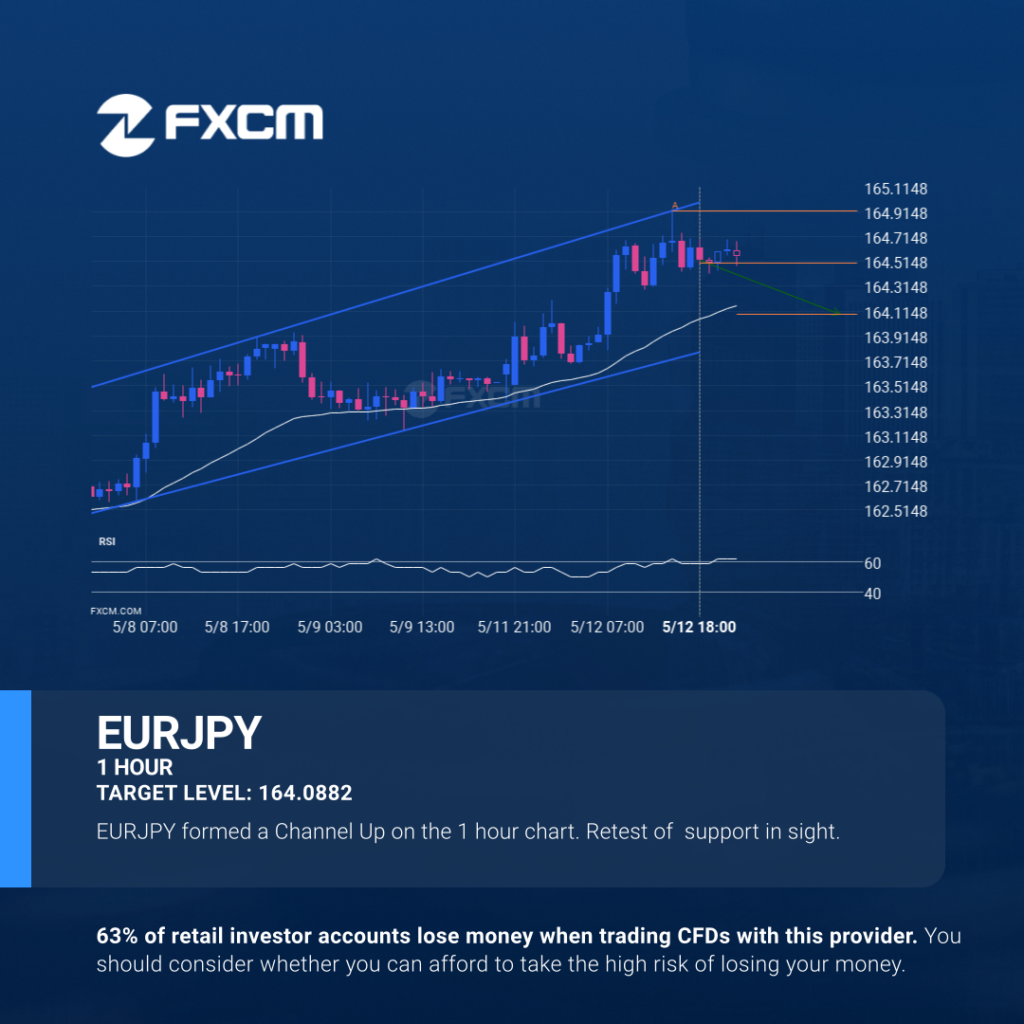
A potential bearish movement on EURJPY

Emerging Channel Up pattern in its final wave was identified on the EURJPY 1 hour chart. After a strong bearish run, we find EURJPY heading towards the upper triangle line with a possible resistance at 164.0882. If the support shows to hold, the Channel Up pattern suggests a rebound back towards current levels. Past performance […]
A potential bearish movement on EURJPY
Emerging Channel Up pattern in its final wave was identified on the EURJPY 1 hour chart. After a strong bearish run, we find EURJPY heading towards the upper triangle line with a possible resistance at 164.0882. If the support shows to hold, the Channel Up pattern suggests a rebound back towards current levels. Past performance […]
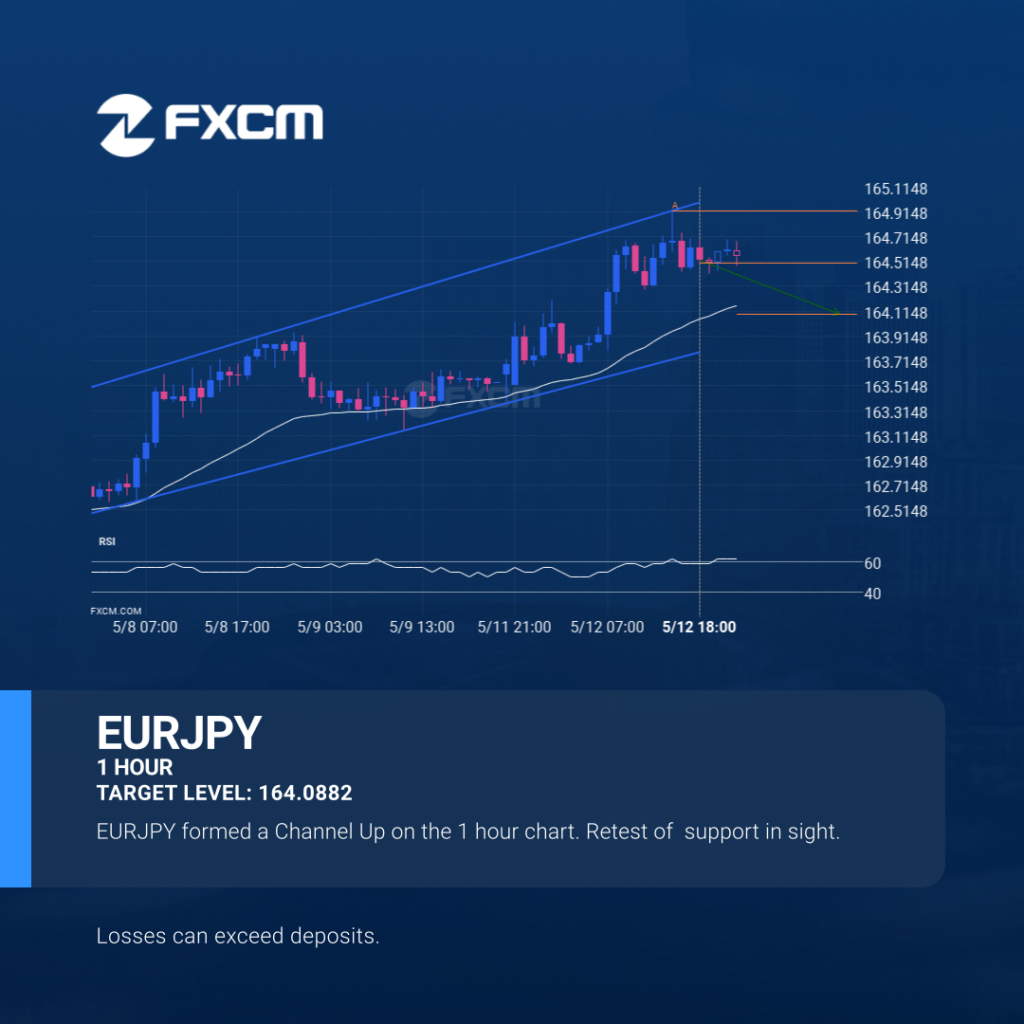
Un posible movimiento bajista en EURJPY

Se detectó un patrón de Canal alcista emergente en EURJPY en el gráfico de 1 Hora. Hay un posible movimiento hacia 164.0882 en las próximas velas. Una vez que alcance el nivel de resistencia, puede continuar su movimiento bajista o retroceder a los niveles de precios actuales. El rendimiento pasado no es indicativo de resultados […]
A potential bearish movement on EURJPY
Emerging Channel Up pattern in its final wave was identified on the EURJPY 1 hour chart. After a strong bearish run, we find EURJPY heading towards the upper triangle line with a possible resistance at 164.0882. If the support shows to hold, the Channel Up pattern suggests a rebound back towards current levels. Past performance […]
BTCUSD va en camino hacia arriba
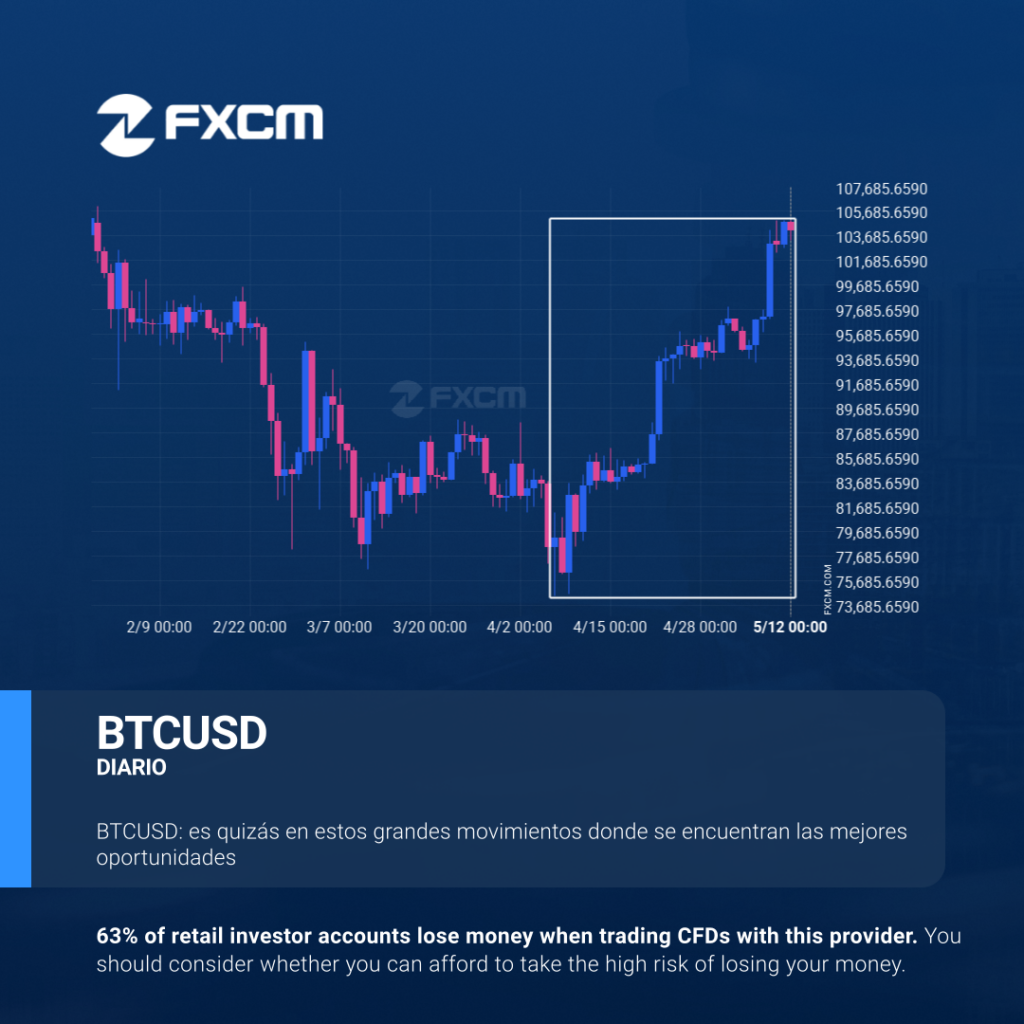
BTCUSD subió bruscamente durante 35 días – lo cual es un movimiento excesivamente grande para este instrumento; excediendo el 98% de los movimientos de precios anteriores. Incluso si este movimiento es una señal de una nueva tendencia en BTCUSD, existe la posibilidad de que presenciemos una corrección, por breve que sea. El rendimiento pasado no […]
Oportunidad rara en EURUSD – movimiento bearish extremo
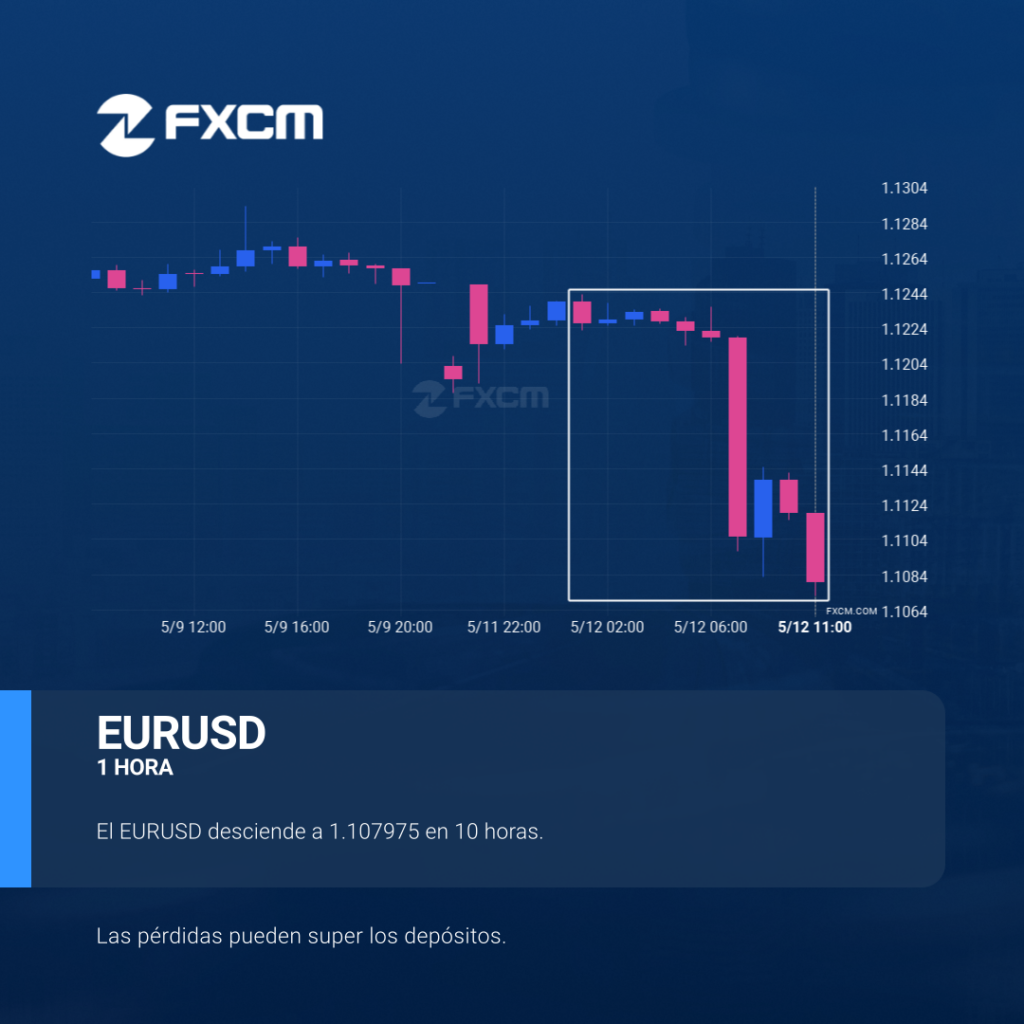
Un movimiento de un 1,3% en 10 horas de EURUSD no pasa desapercibido. Puede empezar a considerar hacía donde se dirigirá ahora: si seguirá con la tendencia descendente actual o volverá a la dirección anterior. El rendimiento pasado no es indicativo de resultados futuros. Las pérdidas pueden exceder los fondos depositados.
Rare opportunity on EURUSD – extreme bearish movement
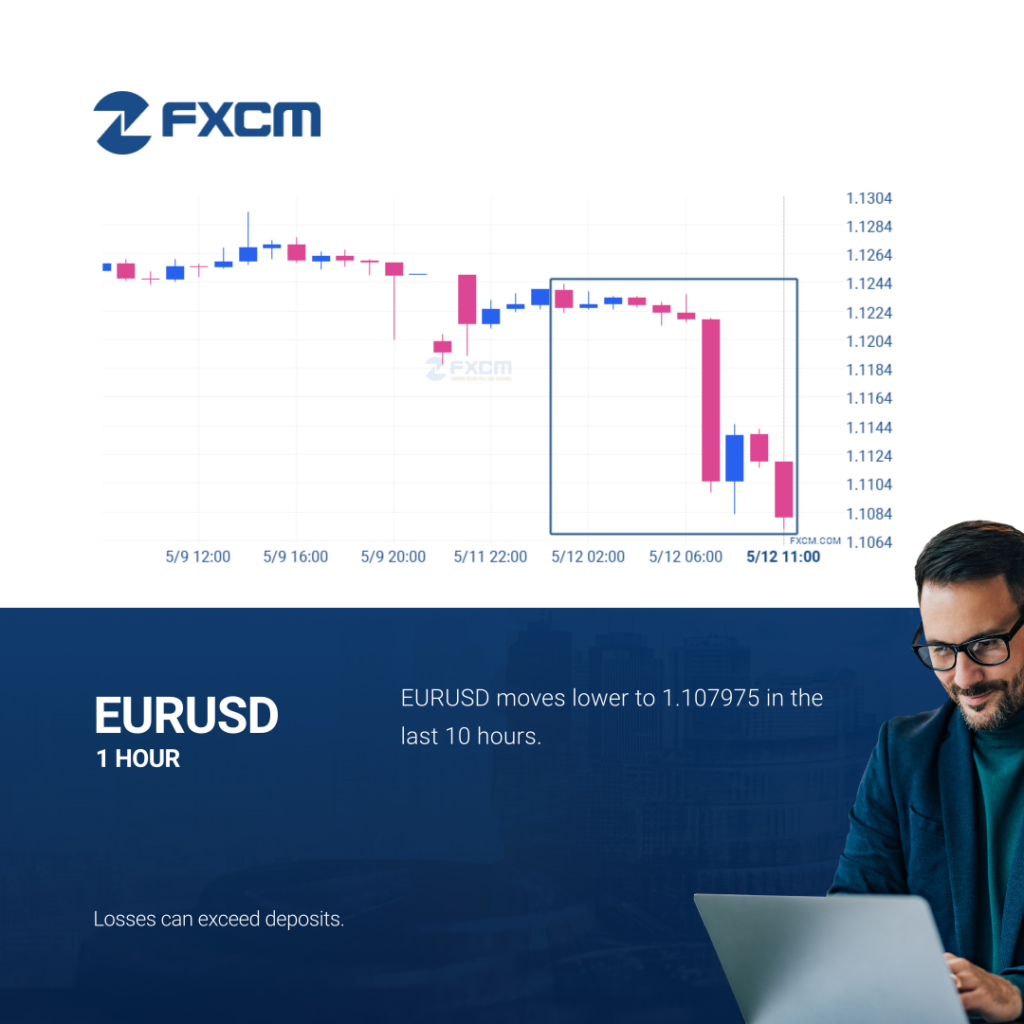
A movement of 1.3% over 10 hours on EURUSD doesn’t go unnoticed. You may start considering where it’s heading next, a continuation of the current downward trend, or a reversal in the previous direction. Past performance is not an indicator of future results. Losses can exceed deposits.
Should we expect a bullish trend on AUDUSD?
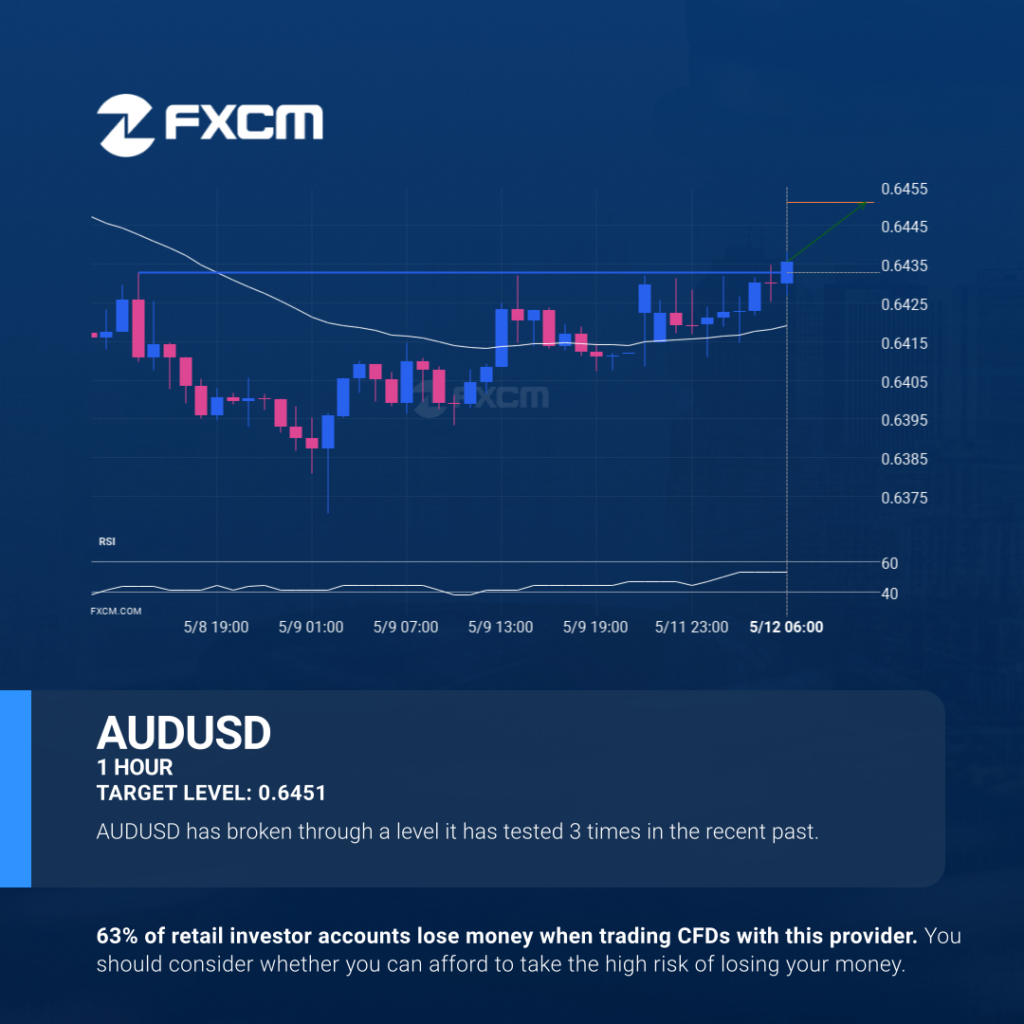
AUDUSD has broken through 0.6433 which it has tested numerous times in the past. We have seen it retrace from this price in the past. If this new trend persists, AUDUSD may be heading towards 0.6451 within the next 9 hours. Past performance is not an indicator of future results. Trading leveraged products carries significant […]