Un giro brusco en EURCHF.
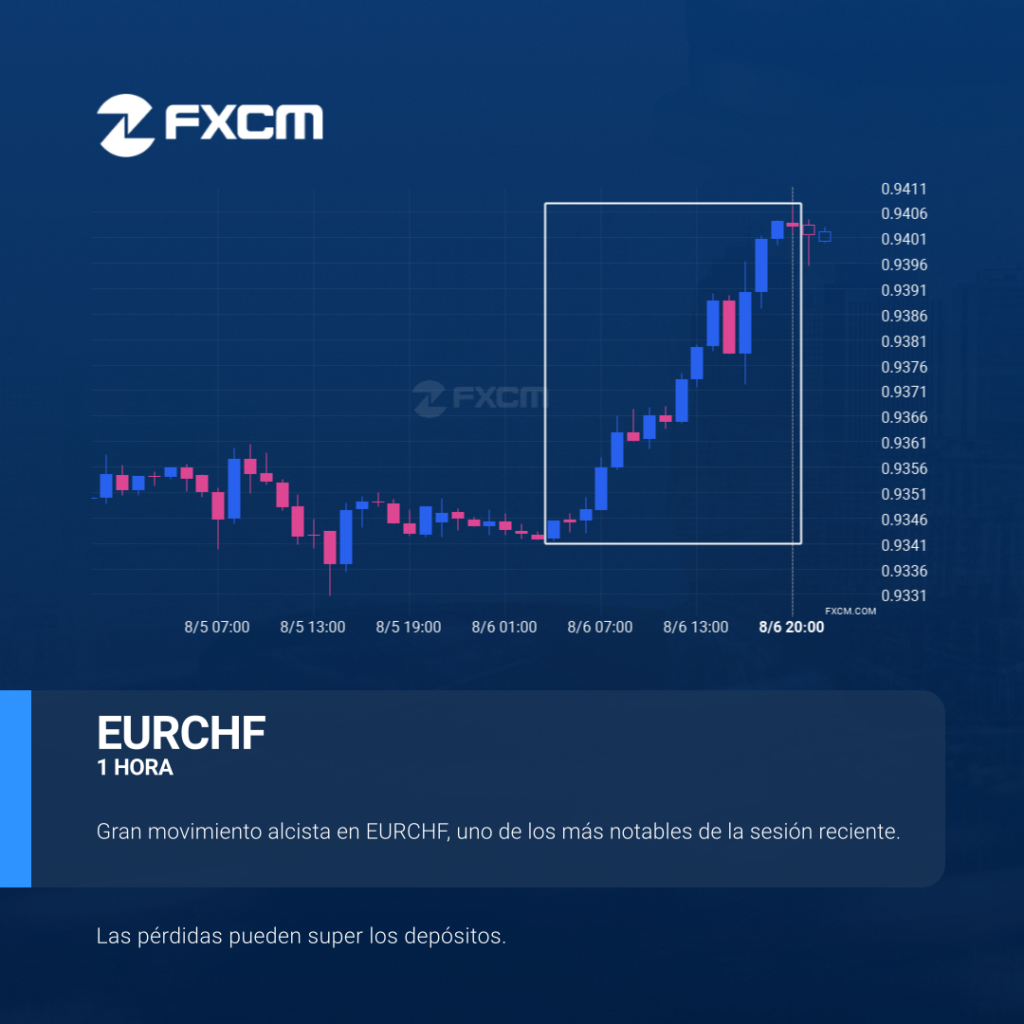
EURCHF alcanzó los 0.9403 tras un movimiento del 0,62% en un período de 16 horas. El rendimiento pasado no es indicativo de resultados futuros. Las pérdidas pueden exceder los fondos depositados.
A sharp shift on EURCHF.
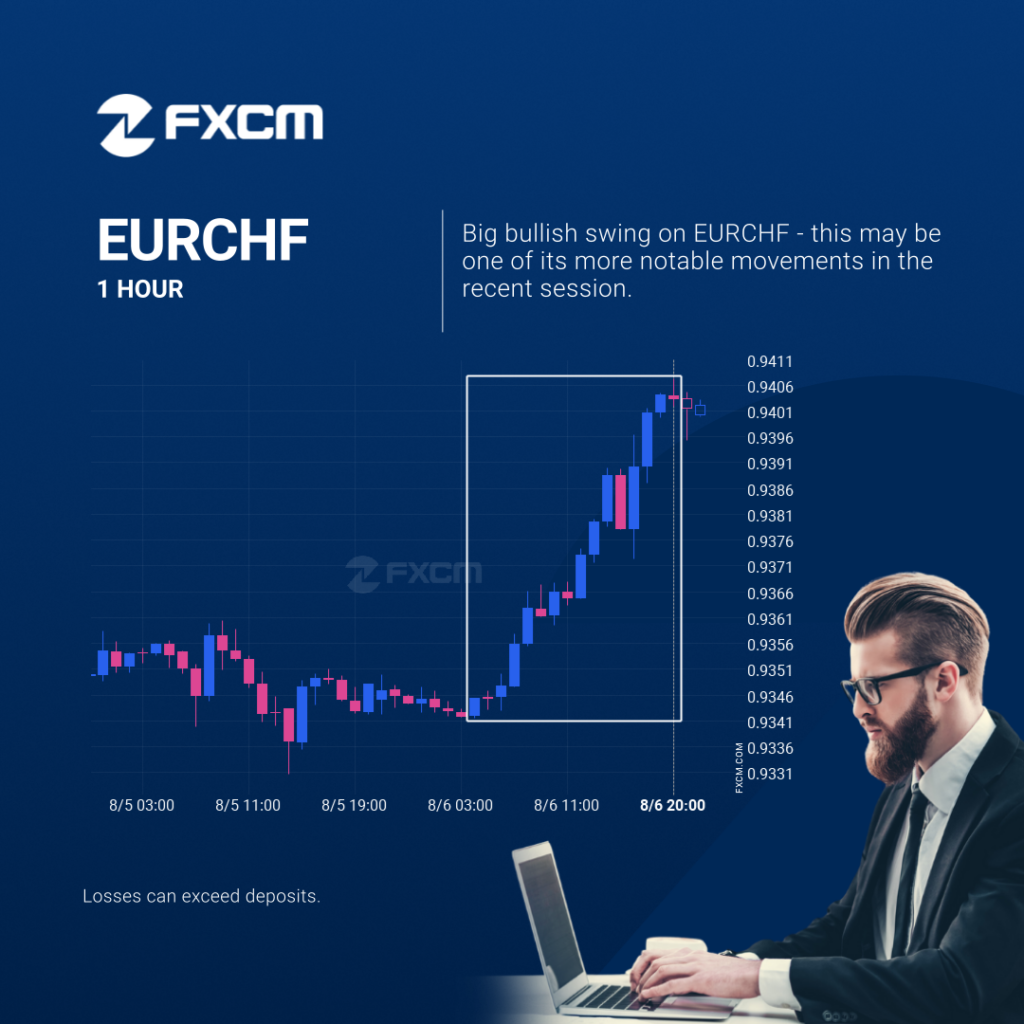
EURCHF reached 0.9403 after a 0.62% move spanning 16 hours. Past performance is not an indicator of future results. Losses can exceed deposits.
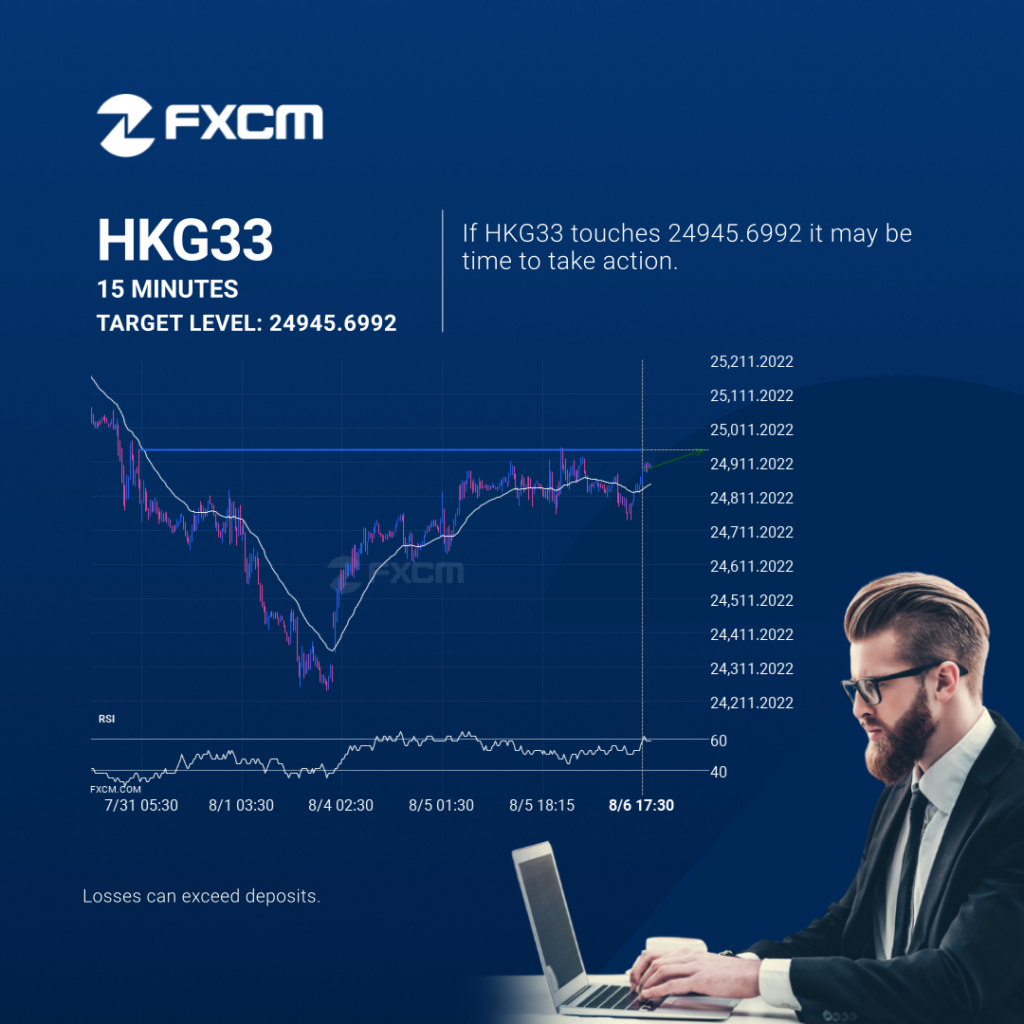
Either a rebound or a breakout imminent on HKG33
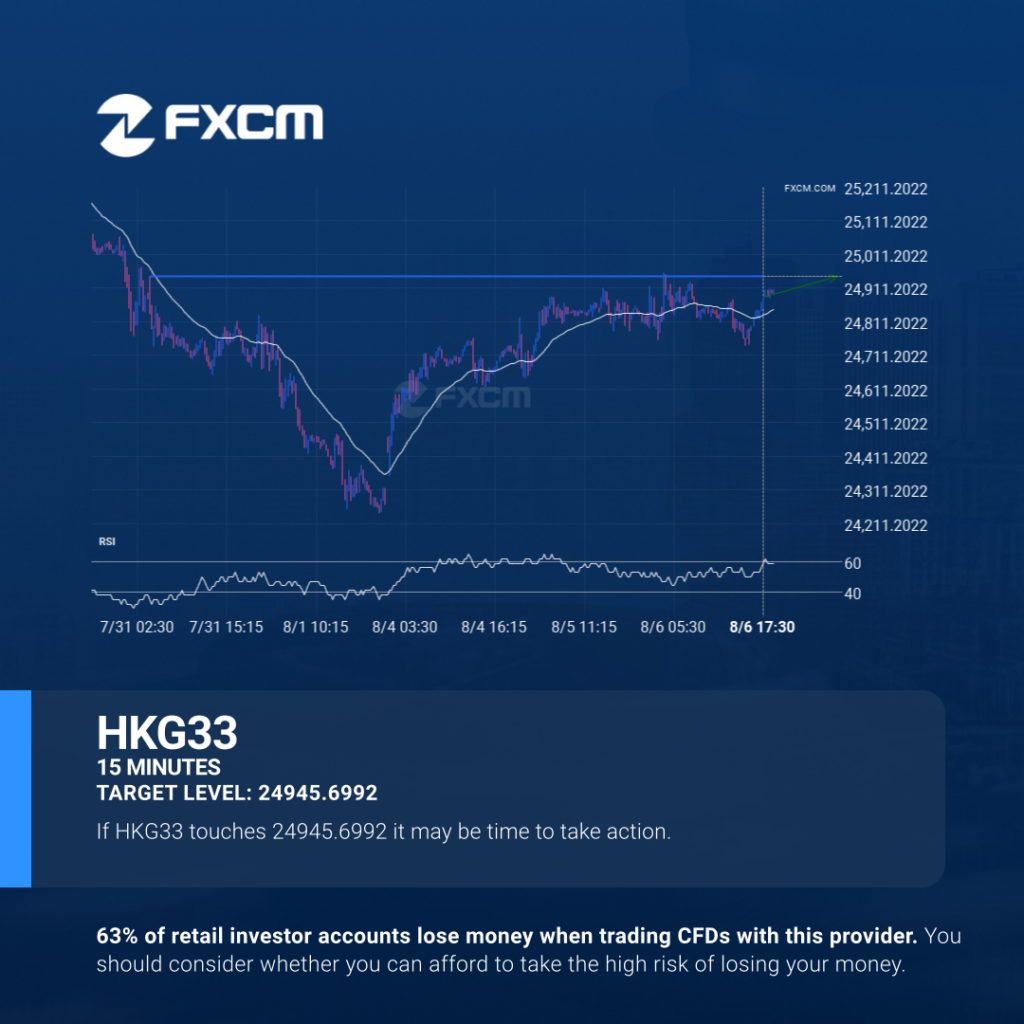
The price of HKG33 in heading back to the resistance area. It is possible that it will struggle to break through it and move back in the other direction. The price may eventually break through, but typically the price retreats from the level a number of times before doing so. Past performance is not an […]
O bien, una inminente recuperación o una ruptura del HKG33
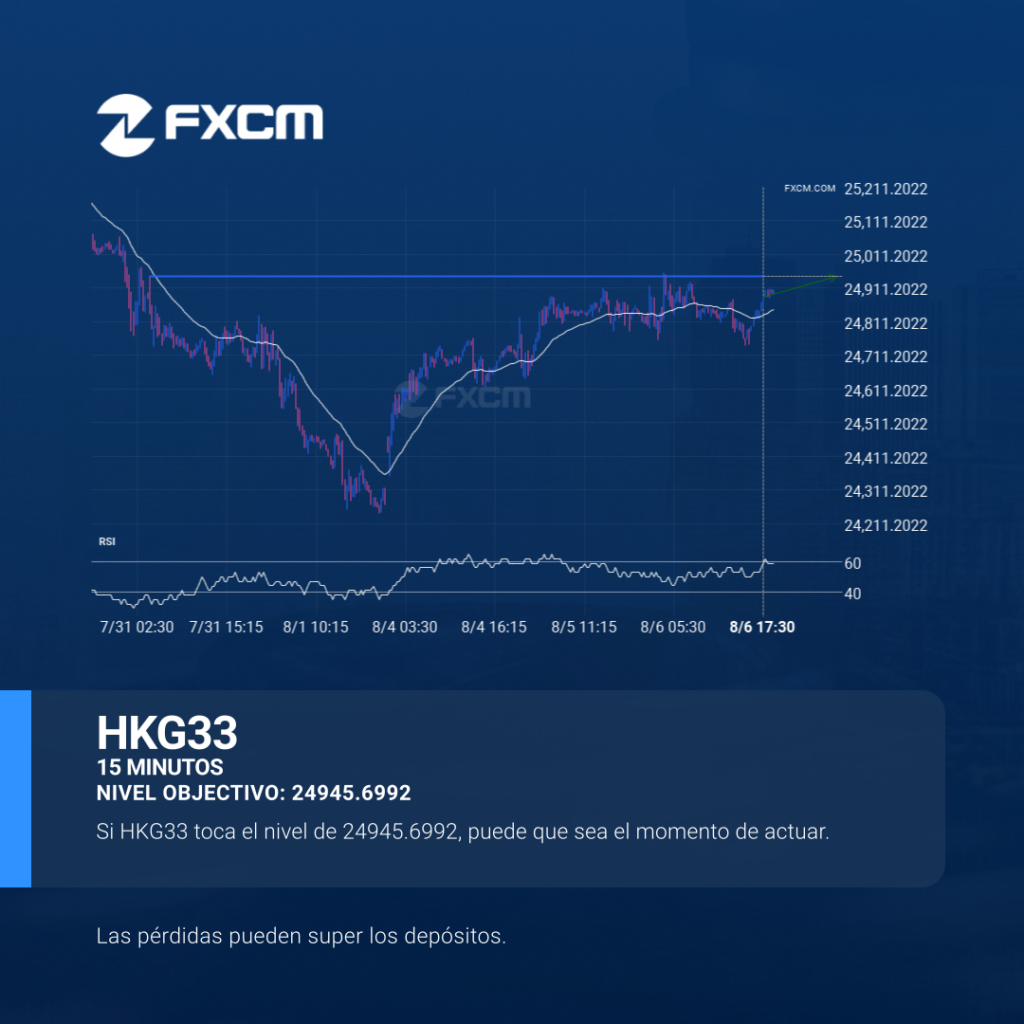
El precio de HKG33 ha vuelto a la zona de resistencia. Es posible que tenga dificultades para atravesarla y que retroceda en la otra dirección. El precio eventualmente puede romper, pero normalmente el precio rebota en el nivel varias veces antes de hacerlo. El rendimiento pasado no es indicativo de resultados futuros. Las pérdidas pueden […]
Either a rebound or a breakout imminent on HKG33
The price of HKG33 in heading back to the resistance area. It is possible that it will struggle to break through it and move back in the other direction. The price may eventually break through, but typically the price retreats from the level a number of times before doing so. Past performance is not an […]
EURJPY short term bullish trade setup to 172.5845
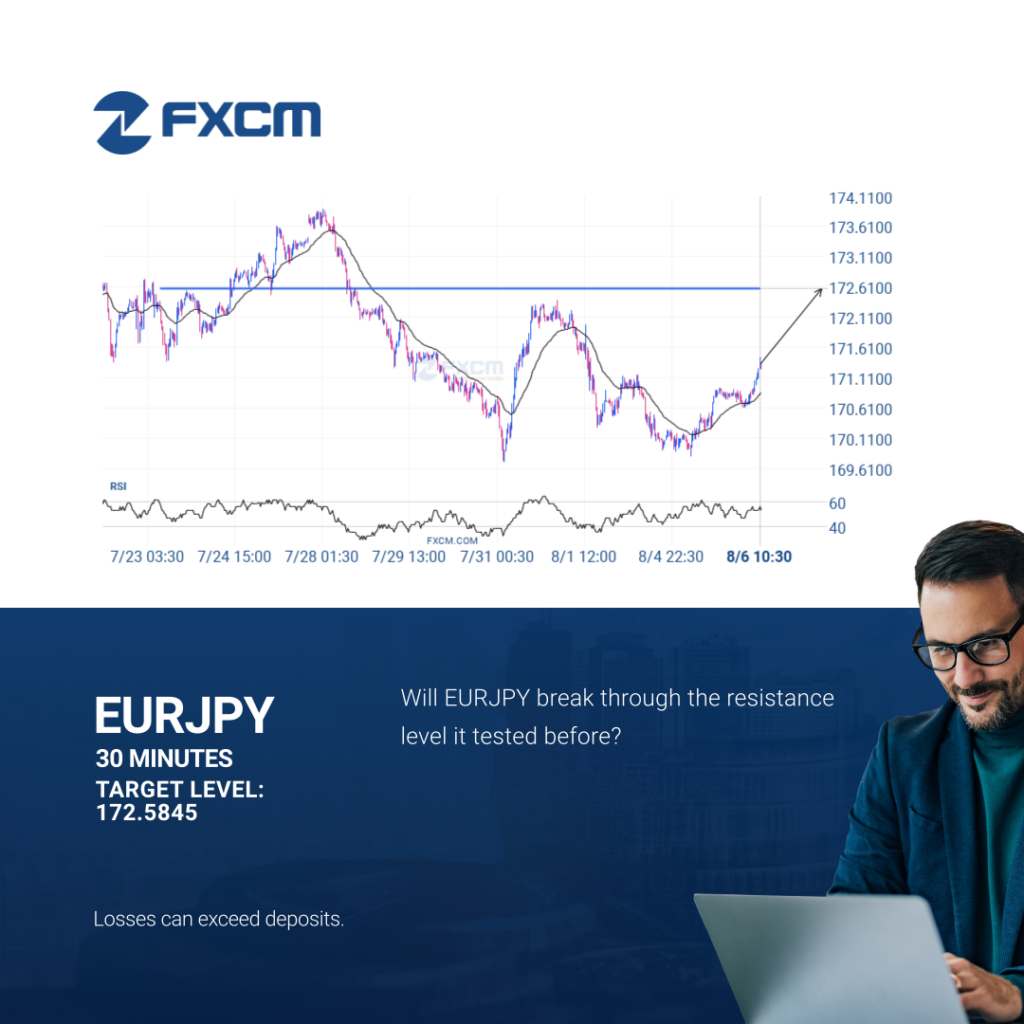
A strong resistance level has been identified at 172.5845 on the 30 Minutes EURJPY chart. EURJPY is likely to test it soon. Past performance is not an indicator of future results. Losses can exceed deposits.
EURJPY: plan para operación alcista a corto plazo hasta 172.5845

Se identificó un fuerte nivel de resistencia en 172.5845 en el gráfico de 30 Minutos de EURJPY. Es probable que EURJPY lo testee pronto. El rendimiento pasado no es indicativo de resultados futuros. Las pérdidas pueden exceder los fondos depositados.
NZDUSD trade outlook at 2025-08-05T22:00:00.000Z until 2025-08-05T22:00:00.000Z
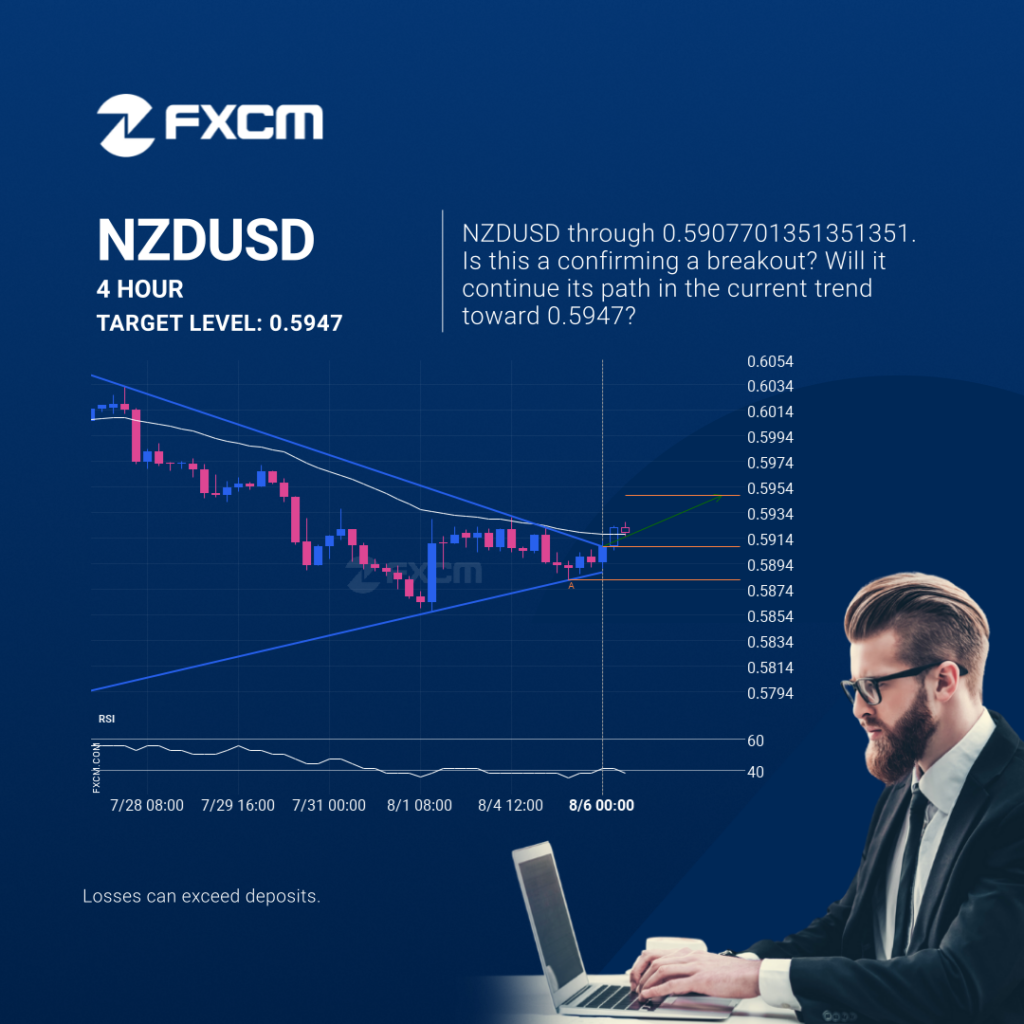
NZDUSD has broken through the resistance line of a Triangle technical chart pattern. Because we have seen it retrace from this line in the past, one should wait for confirmation of the breakout before taking any action. It has touched this line twice in the last 20 days and suggests a possible target level to […]
NZDUSD trade outlook at 2025-08-05T22:00:00.000Z until 2025-08-05T22:00:00.000Z
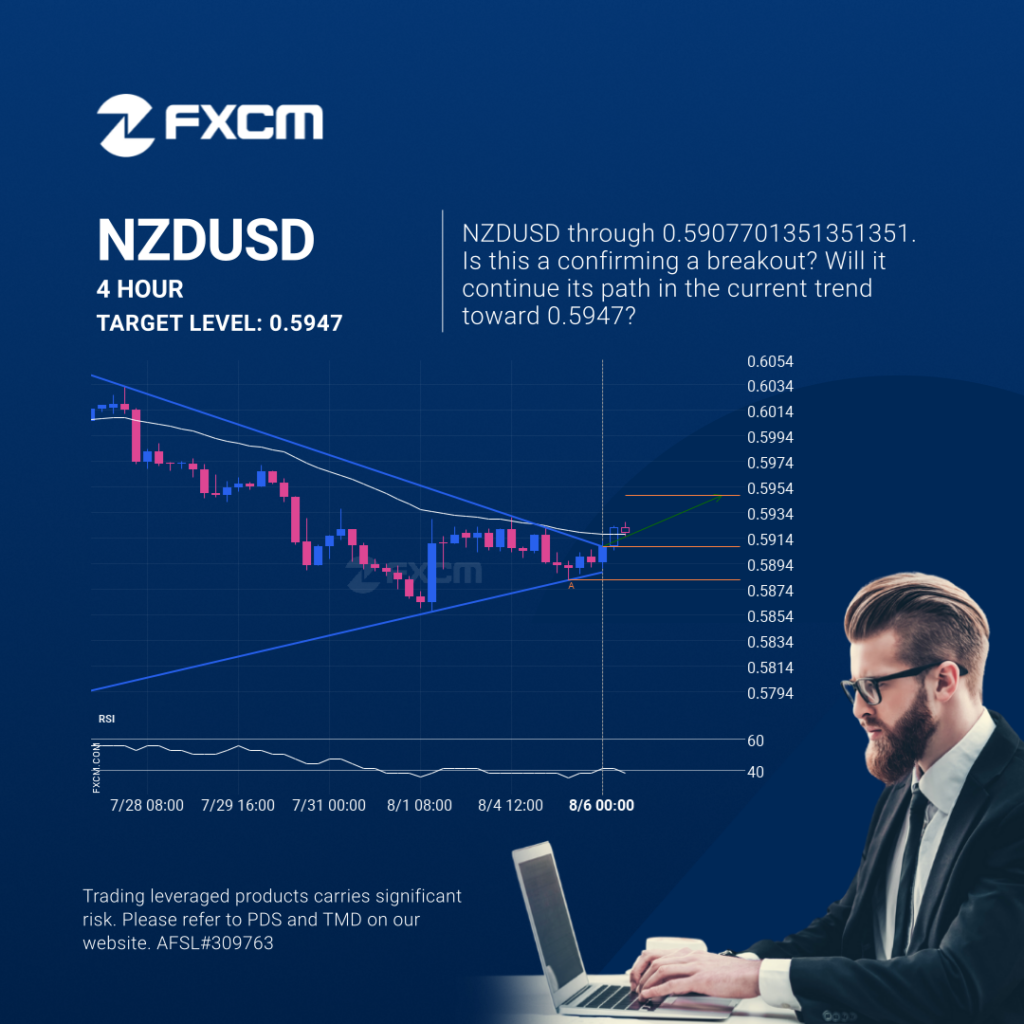
NZDUSD has broken through the resistance line of a Triangle technical chart pattern. Because we have seen it retrace from this line in the past, one should wait for confirmation of the breakout before taking any action. It has touched this line twice in the last 20 days and suggests a possible target level to […]
Previsión de trading de NZDUSD a las 2025-08-05T22:00:00.000Z hasta las 2025-08-05T22:00:00.000Z

El NZDUSD ha atravesado la línea de resistencia de un patrón de gráfico técnico con un Triángulo. Como le hemos visto retroceder desde esta posición en el pasado, deberíamos esperar la confirmación de la ruptura antes de actuar. Ha llegado a esta línea dos veces en los últimos 20 días y sugiere un posible nivel […]