A potential bullish movement on EURUSD
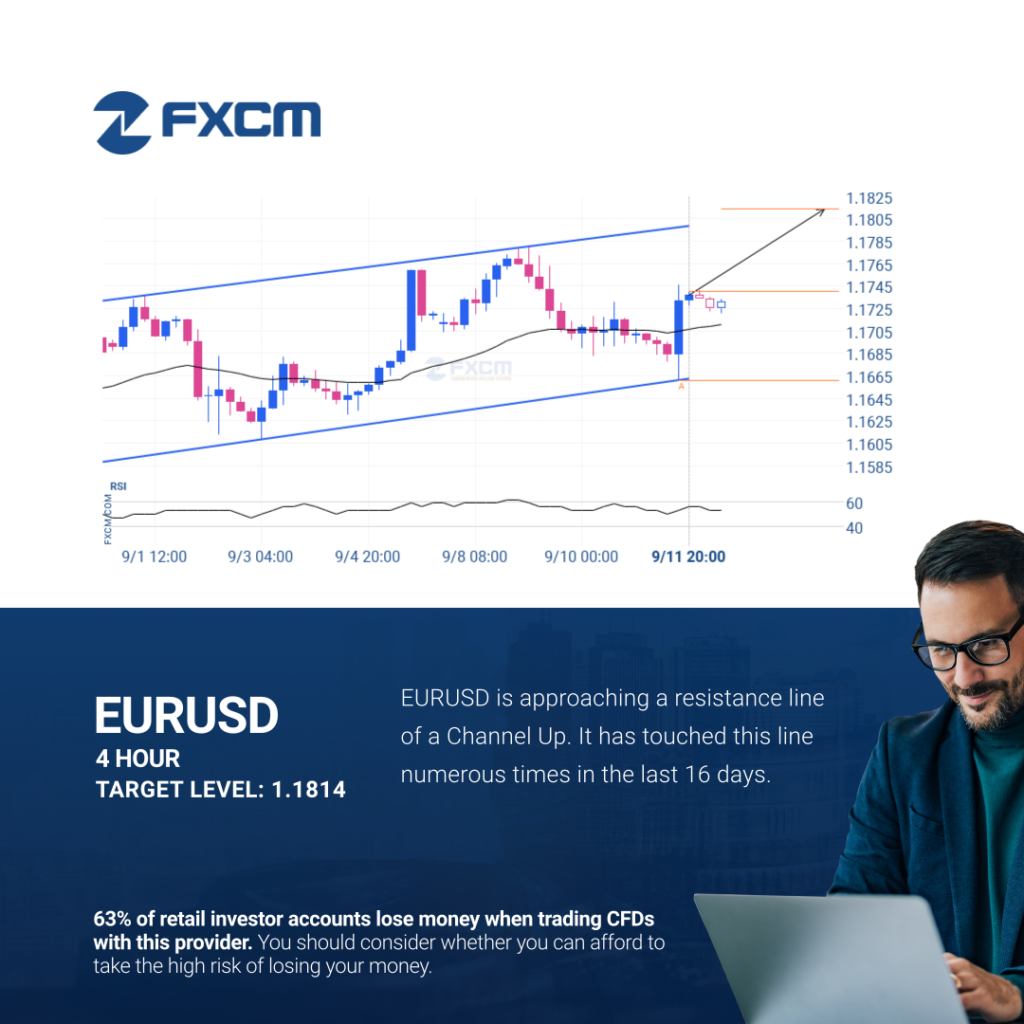
EURUSD was identified at around 1.173975 having recently rebounded of the support on the 4 hour data interval. Ultimately, the price action of the stock has formed a Channel Up pattern. This squeeze may increases the chances of a strong breakout. The projected movement will potentially take the price to around the 1.1814 level. Past […]
A potential bullish movement on EURUSD
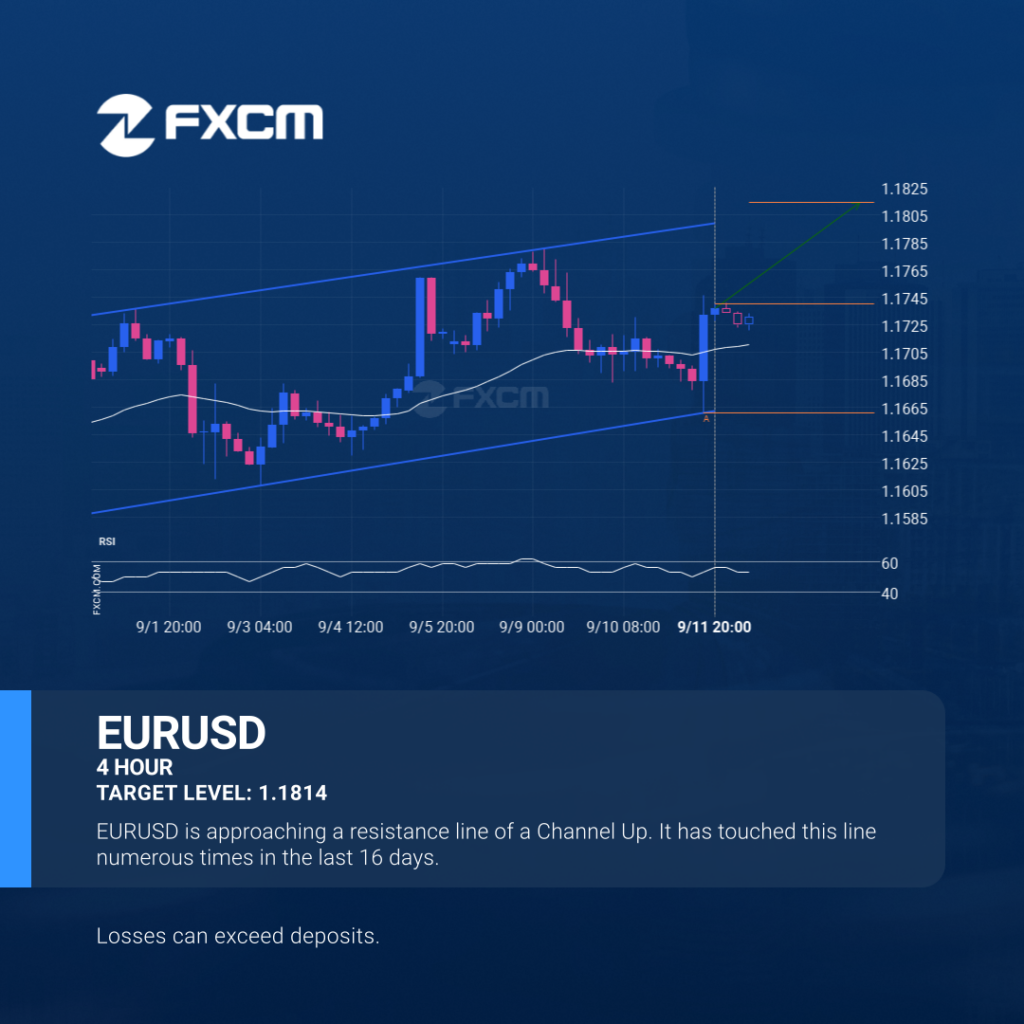
EURUSD was identified at around 1.173975 having recently rebounded of the support on the 4 hour data interval. Ultimately, the price action of the stock has formed a Channel Up pattern. This squeeze may increases the chances of a strong breakout. The projected movement will potentially take the price to around the 1.1814 level. Past […]
Un posible movimiento alcista en EURUSD
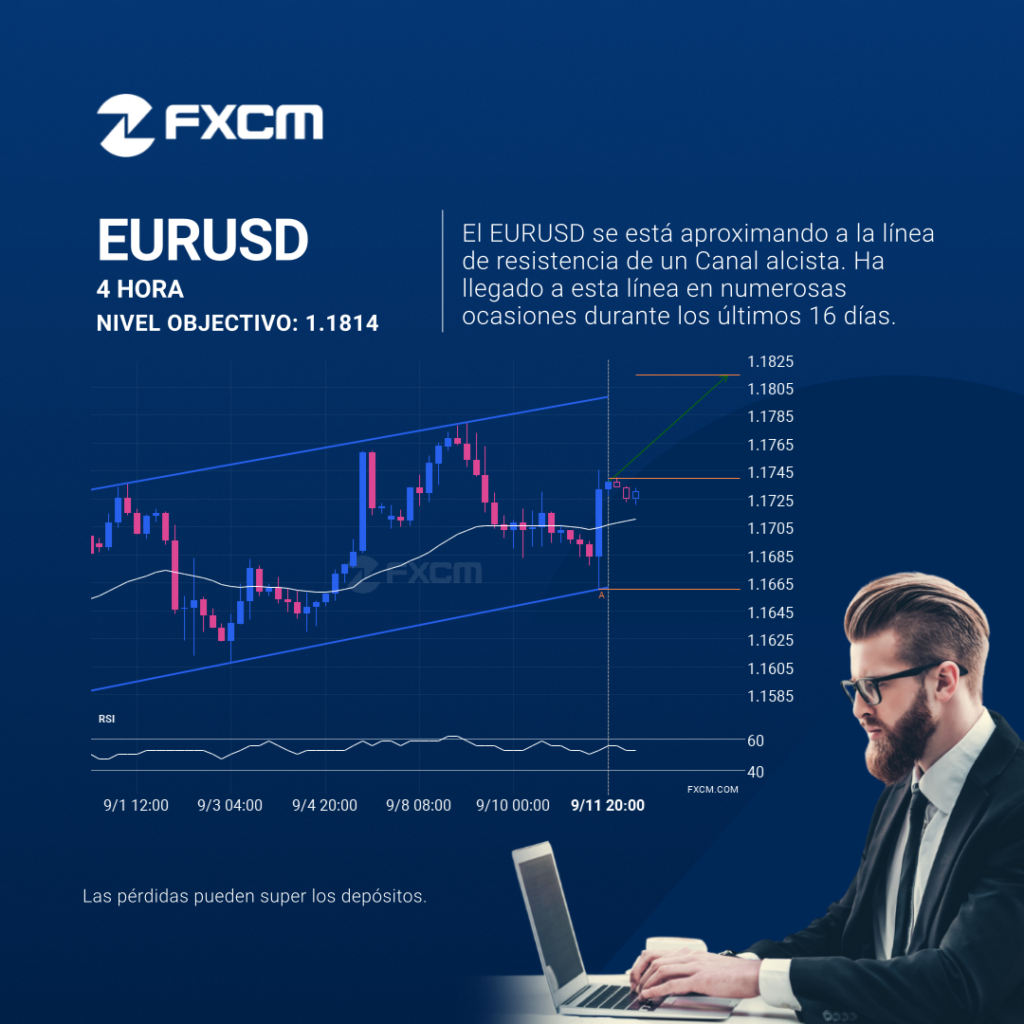
Se identificó un patrón de Canal alcista en EURUSD en 1.173975, lo que generó la expectativa de que podría moverse a la línea de resistencia en 1.1814. Puede atravesar esa línea y continuar la tendencia alcista o puede girarse desde esa línea. El rendimiento pasado no es indicativo de resultados futuros. Las pérdidas pueden exceder […]
A potential bullish movement on EURUSD
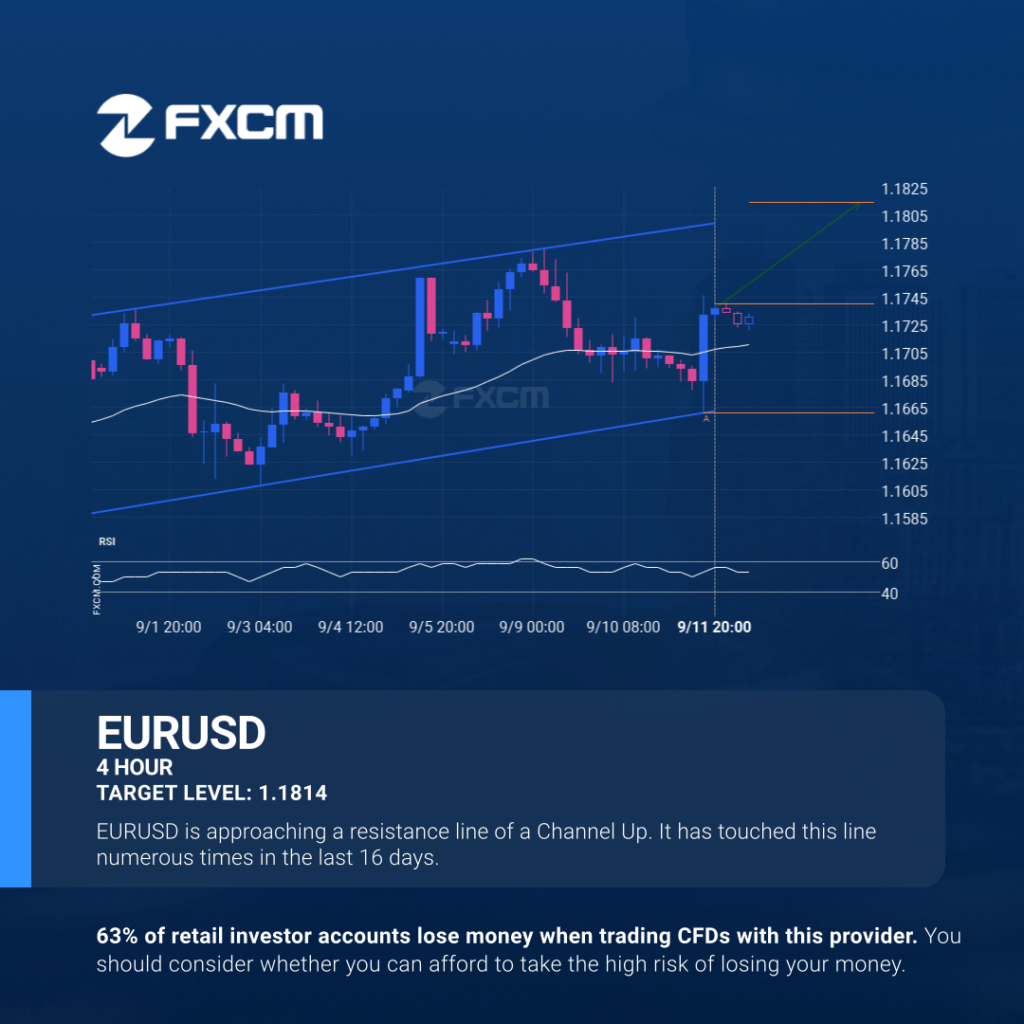
EURUSD was identified at around 1.173975 having recently rebounded of the support on the 4 hour data interval. Ultimately, the price action of the stock has formed a Channel Up pattern. This squeeze may increases the chances of a strong breakout. The projected movement will potentially take the price to around the 1.1814 level. Past […]
Inminente recuperación o irrupción del EURGBP
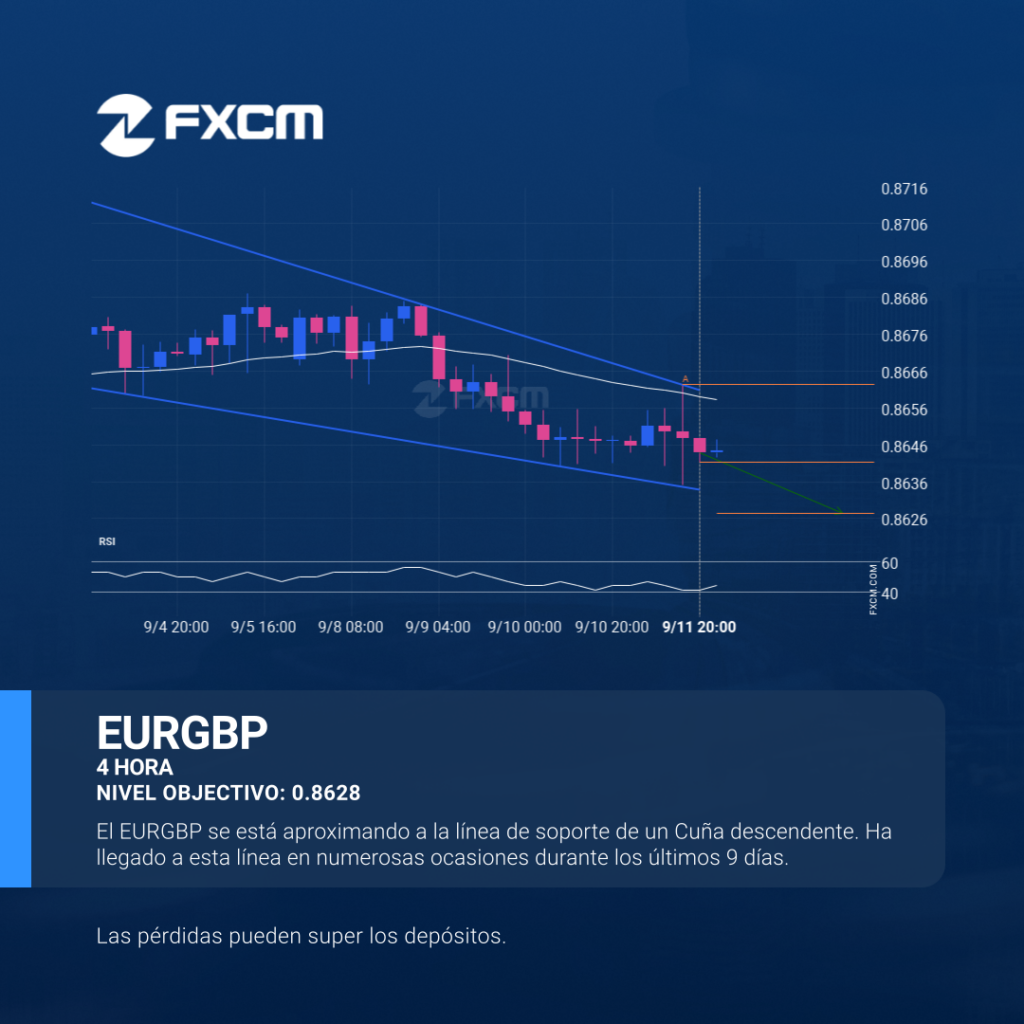
EURGBP está atrapado en una formación de Cuña descendente, lo que implica que una rotura es inminente. Esta es una excelente configuración de trading tanto para los operadores de tendencia como para los de swing. Ahora se está acercando a una línea de resistencia que se testeó en el pasado. Los oportunistas de la divergencia […]
Either a rebound or a breakout imminent on EURGBP

A Falling Wedge pattern was identified on EURGBP at 0.864145, creating an expectation that it may move to the support line at 0.8628. It may break through that line and continue the bearish trend or it may reverse from that line. Past performance is not an indicator of future results. Losses can exceed deposits.
ESP35 is on its way up
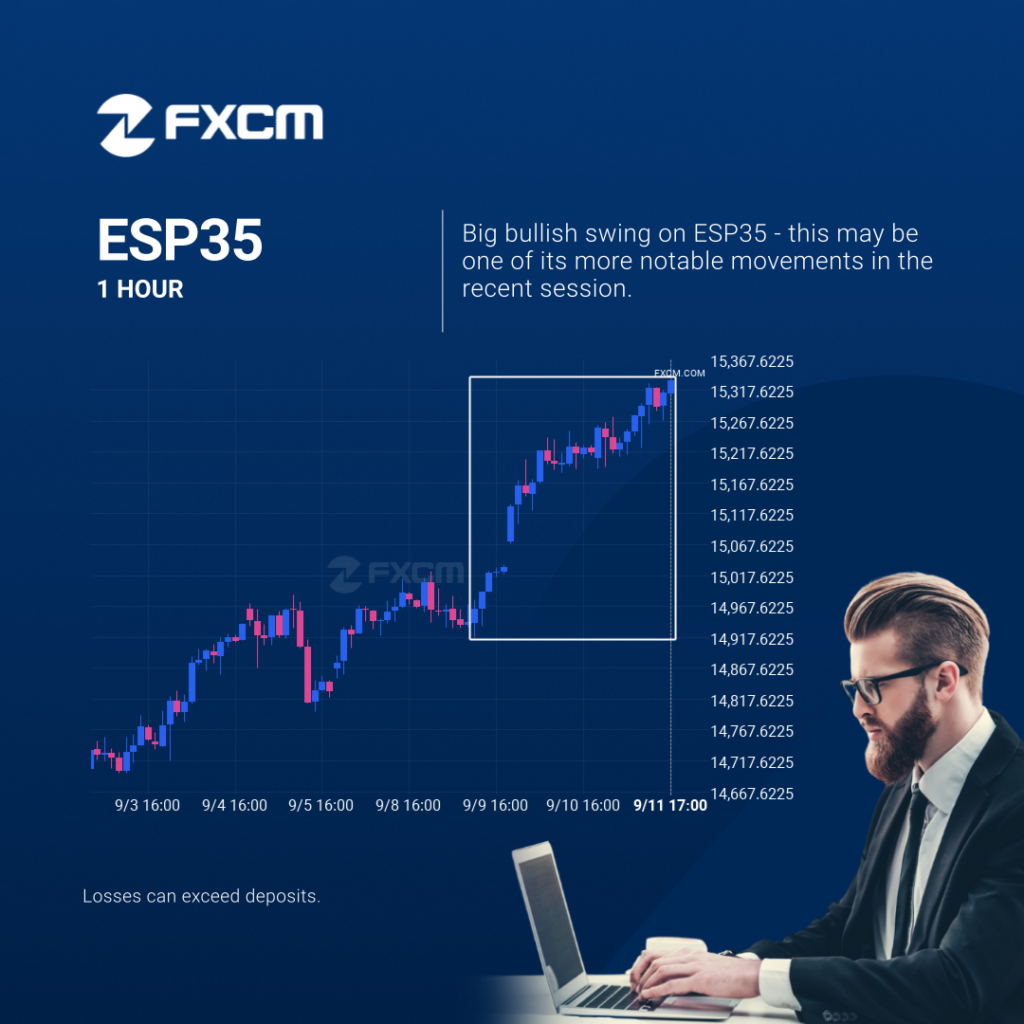
ESP35 rose sharply for 2 days, marking an unusually large move, exceeding 98% of past price shifts for this instrument. Past performance is not an indicator of future results. Losses can exceed deposits.
ESP35 va en dirección ascendente.

ESP35 subió bruscamente durante 2 días, marcando un movimiento inusualmente grande que supera el 98% de los cambios anteriores en este instrumento. El rendimiento pasado no es indicativo de resultados futuros. Las pérdidas pueden exceder los fondos depositados.
A possible start of a bullish trend on EURJPY

Triangle pattern identified on EURJPY has broken through a resistance level with the price momentum continuing to move in an upward direction. A solid trading opportunity continues with the price expected to reach 172.9935 in the next 13. Past performance is not an indicator of future results. Trading leveraged products carries significant risk. Please refer […]
Un posible comienzo de una tendencia alcista en el EURJPY
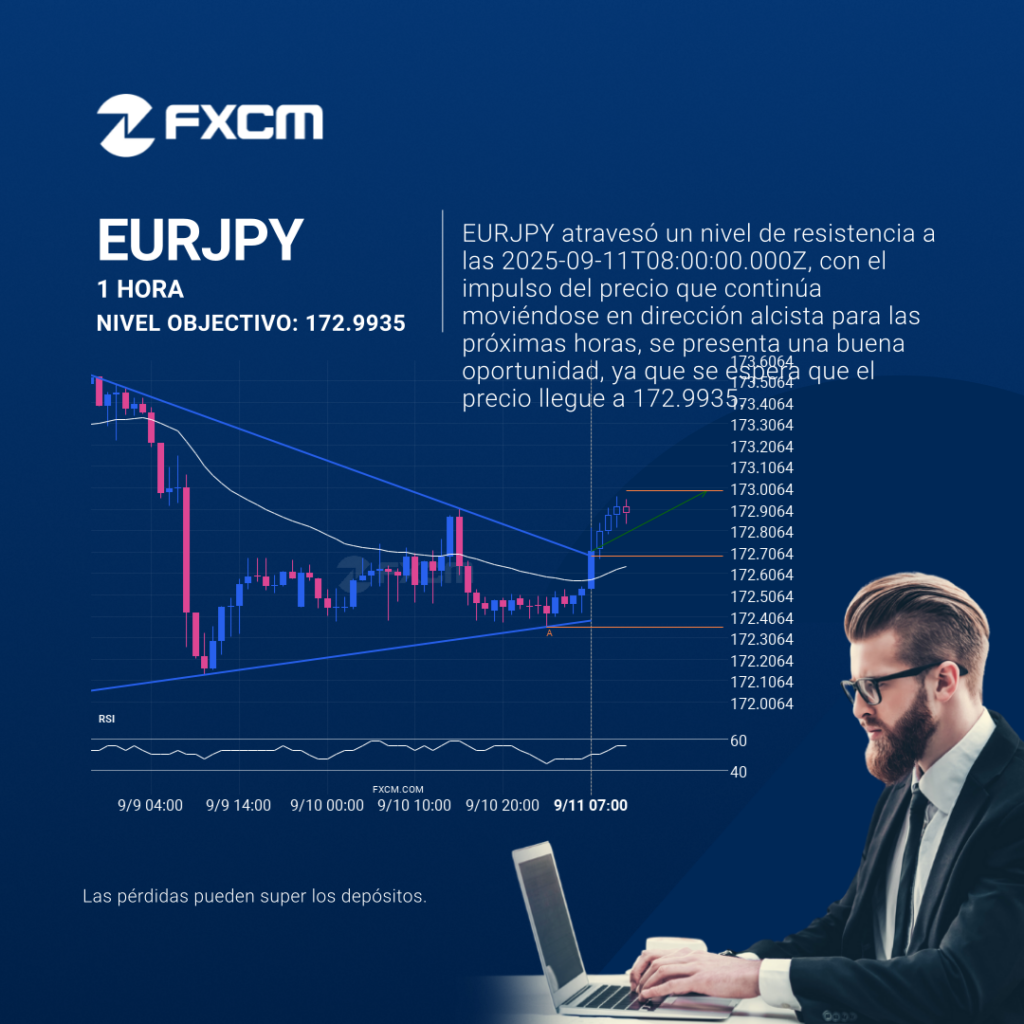
El patrón de Triángulo identificado en EURJPY ha atravesado un nivel de resistencia y el impulso del precio continúa moviéndose en dirección alcista. Continúa siendo una buena oportunidad de trading y se espera que el precio alcance 172.9935 en un plazo de 13. El rendimiento pasado no es indicativo de resultados futuros. Las pérdidas pueden […]