Continuation pattern on HKG33
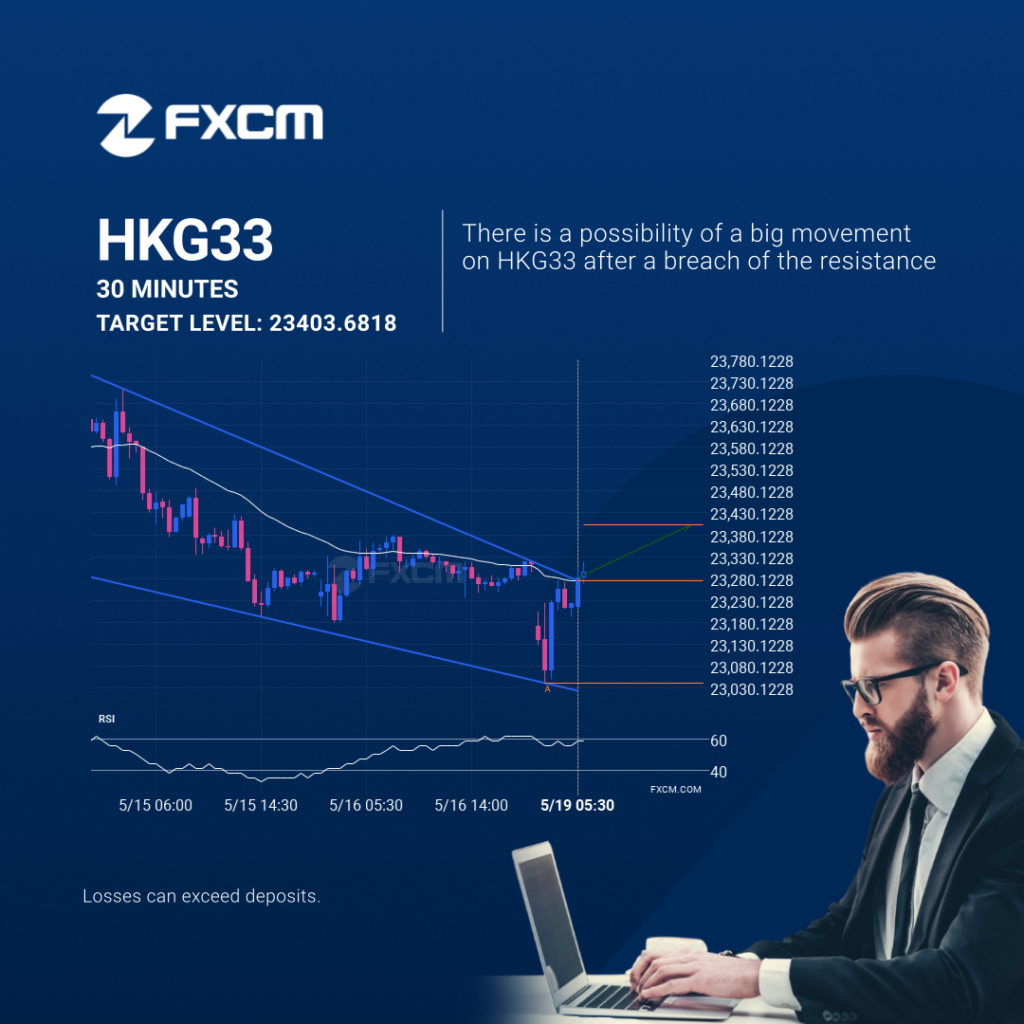
HKG33 has broken through a resistance line. It has touched this line at least twice in the last 6 days. This breakout may indicate a potential move to 23403.6818 within the next 10 hours. Because we have seen it retrace from this position in the past, one should wait for confirmation of the breakout before […]
Continuation pattern on HKG33
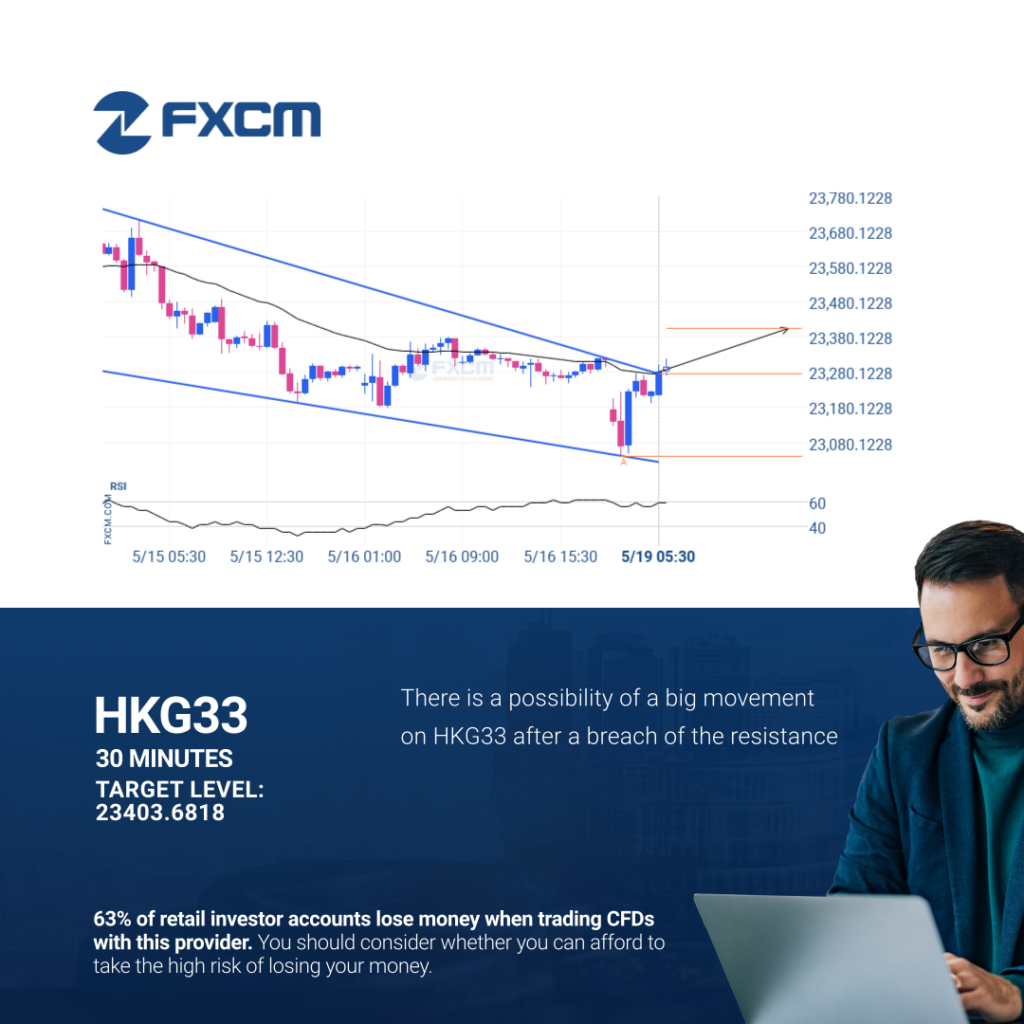
HKG33 has broken through a resistance line. It has touched this line at least twice in the last 6 days. This breakout may indicate a potential move to 23403.6818 within the next 10 hours. Because we have seen it retrace from this position in the past, one should wait for confirmation of the breakout before […]
Patrón Continuation en HKG33
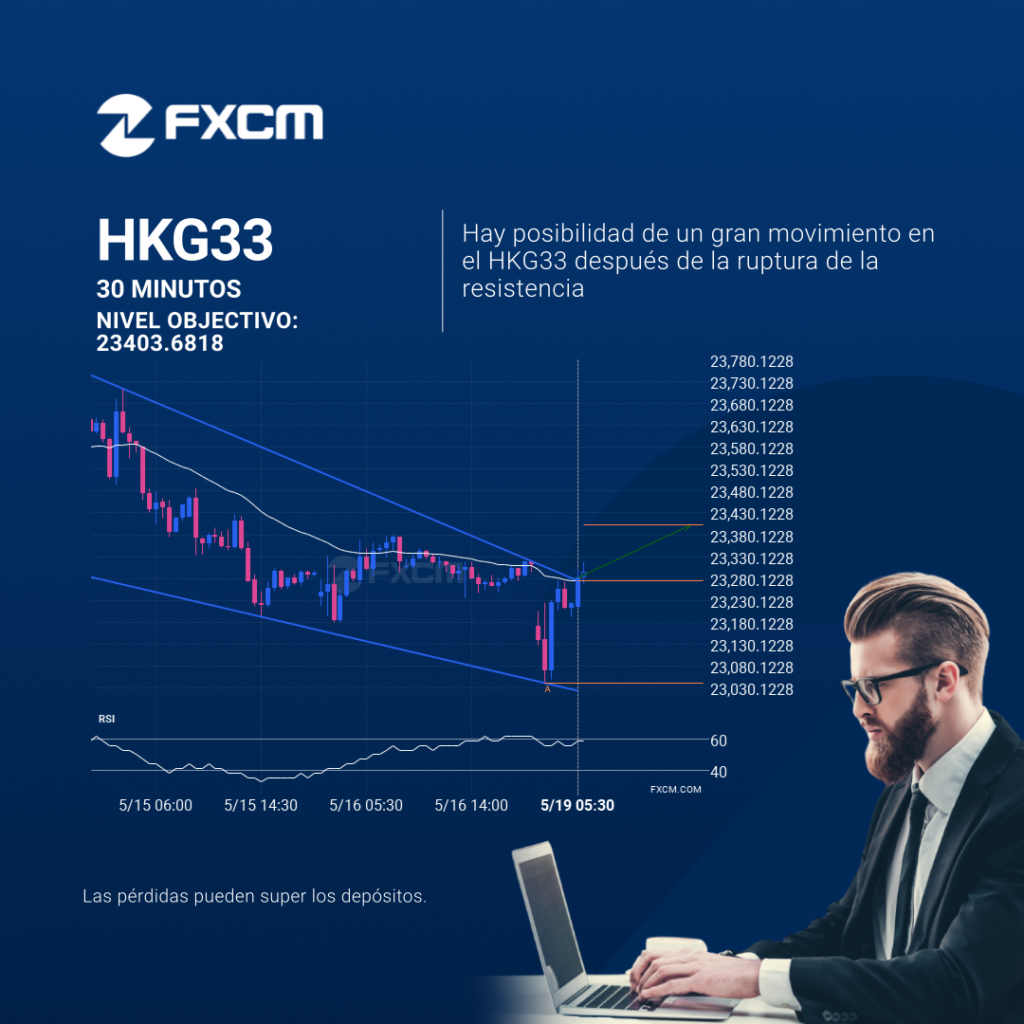
El HKG33 atravesó una línea de resistencia. Ha entrado en contacto con esta línea por lo menos dos veces en 6 días. Esta ruptura puede indicar un movimiento potencial a 23403.6818 en 10 horas. Como ya vimos un retroceso de esta posición en el pasado, debemos esperar la confirmación de la ruptura antes de operar. […]
Rotura de Triángulo en AUDUSD
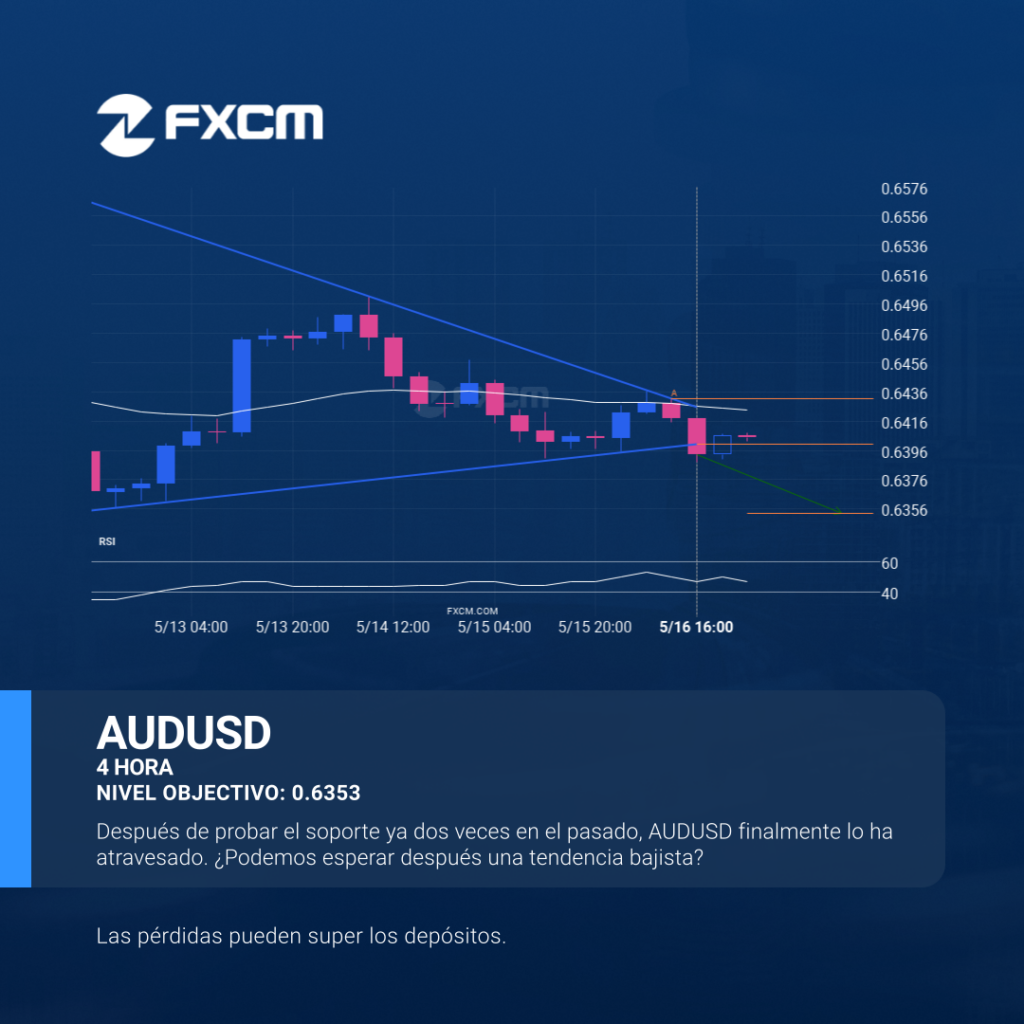
Las últimas 5 velas de 4 Hora en AUDUSD formaron un patrón de Triángulo y rompieron a través de las líneas del patrón, lo que indica un posible movimiento bajista hacia el nivel de precio en 0.6353. El rendimiento pasado no es indicativo de resultados futuros. Las pérdidas pueden exceder los fondos depositados.
Triangle breakout on AUDUSD
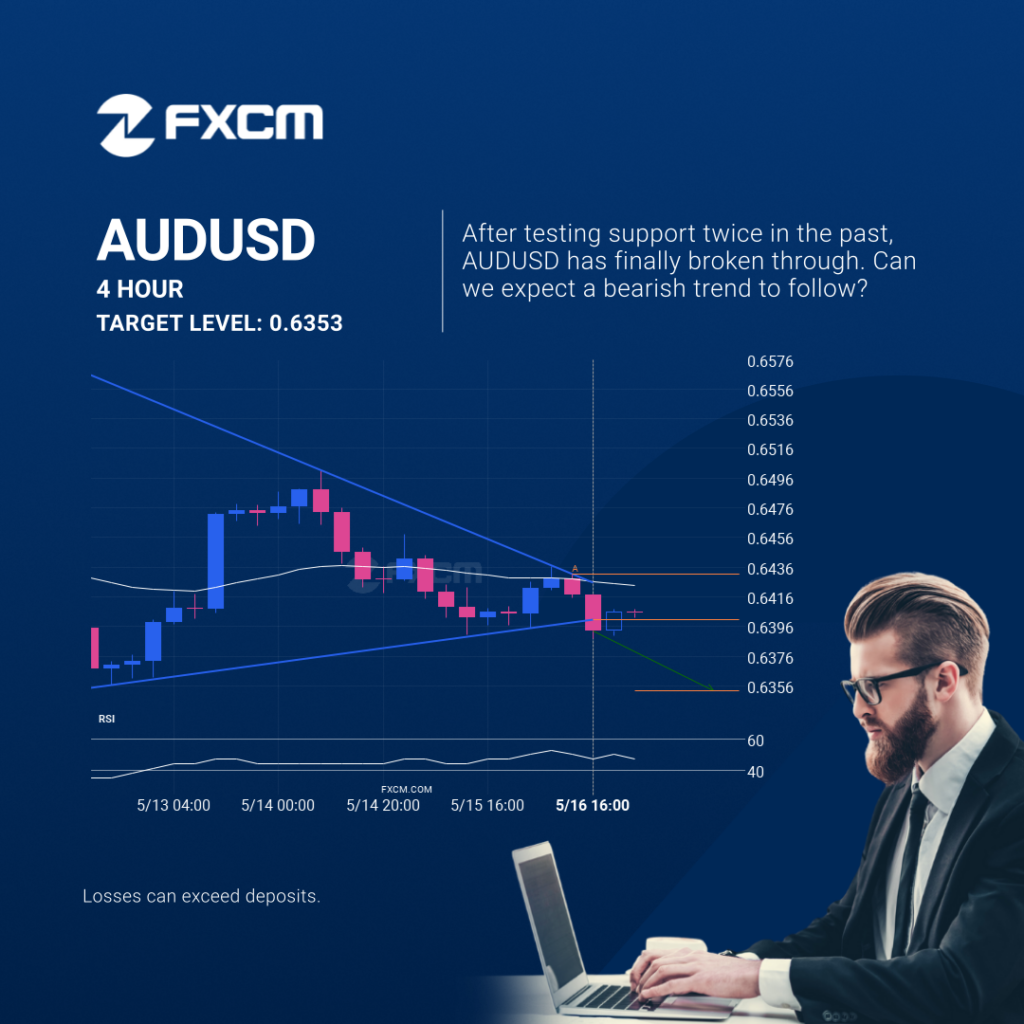
The last 5 4 hour candles on AUDUSD formed a Triangle pattern and broken out through the pattern lines, indicating a possible bearish movement towards the price level of 0.6353. Past performance is not an indicator of future results. Losses can exceed deposits.
Posible comienzo de una tendencia alcista cuando BTCUSD rompa el nivel de resistencia
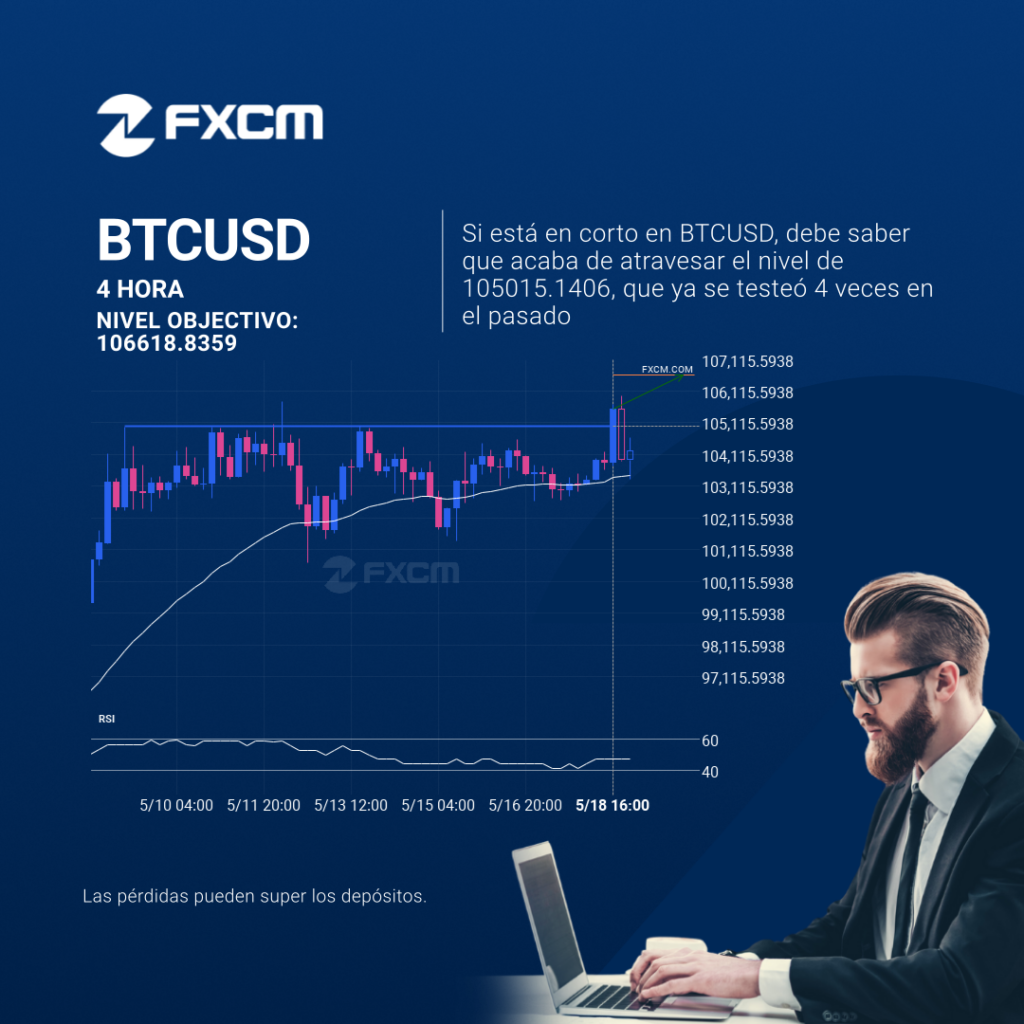
La rotura del BTCUSD a través de la línea de precio en 105015.1406 es una brecha de un importante precio psicológico que se ha probado numerosas veces en el pasado. Si esta rotura persiste, el BTCUSD podría probar el nivel de 106618.8359 durante las siguientes 2 días. Habría que ser prudentes antes de ejecutar una […]
USDCAD – acercándose a la resistencia del Triángulo
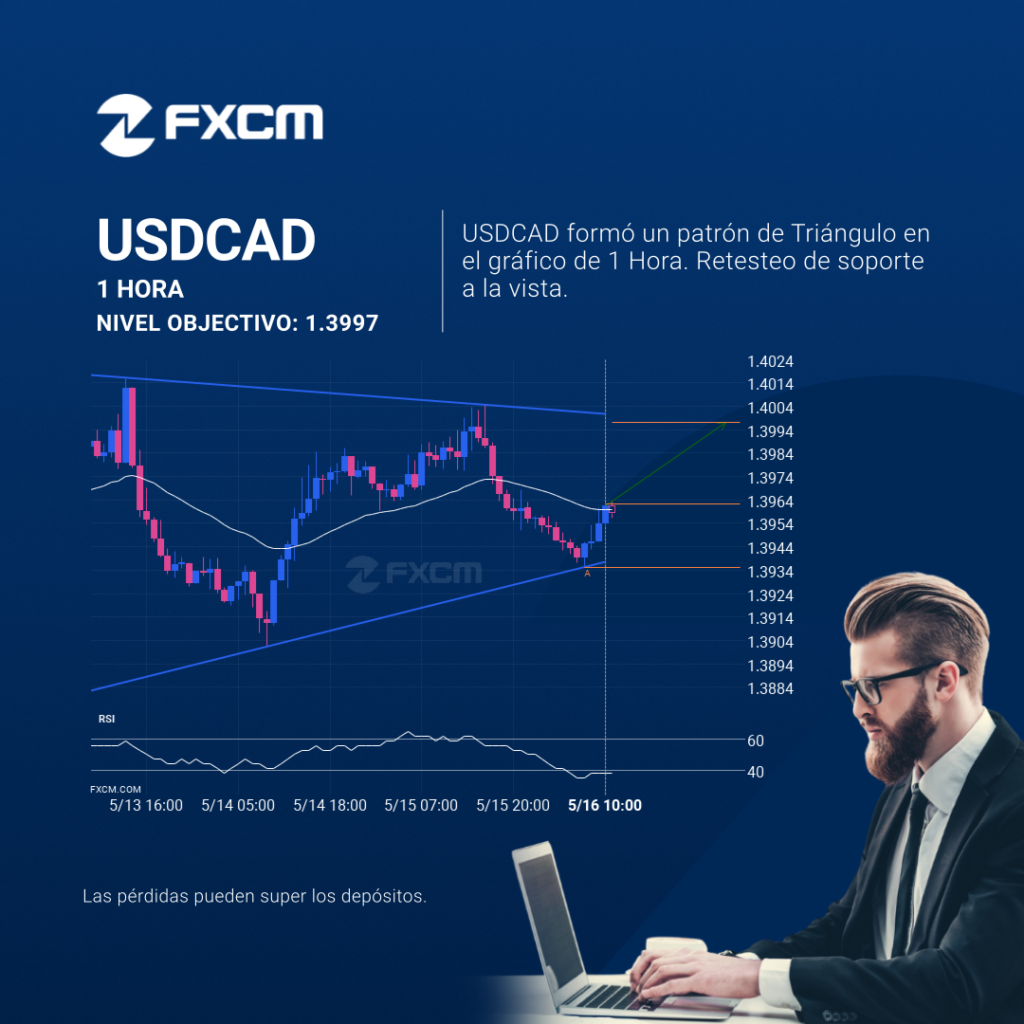
El USDCAD se está acercando a la línea de resistencia de un Triángulo. Ha llegado a esta línea en numerosas ocasiones durante los últimos 5 días. Si vuelve a probarla de nuevo, debería hacerlo en las próximas 21 horas. El rendimiento pasado no es indicativo de resultados futuros. Las pérdidas pueden exceder los fondos depositados.
USDCAD – getting close to resistance of a Triangle
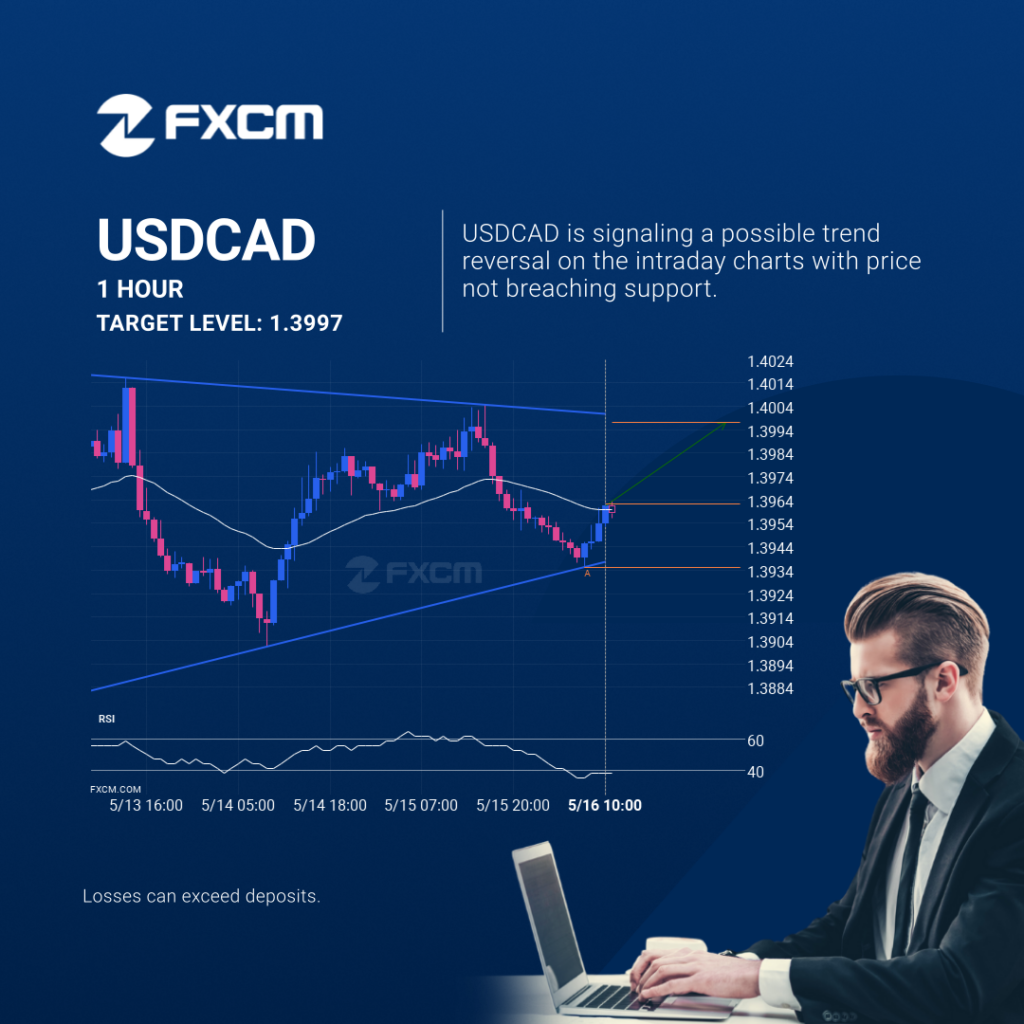
USDCAD is approaching the resistance line of a Triangle. It has touched this line numerous times in the last 5 days. If it tests this line again, it should do so in the next 21 hours. Past performance is not an indicator of future results. Losses can exceed deposits.
USDCAD – getting close to resistance of a Triangle
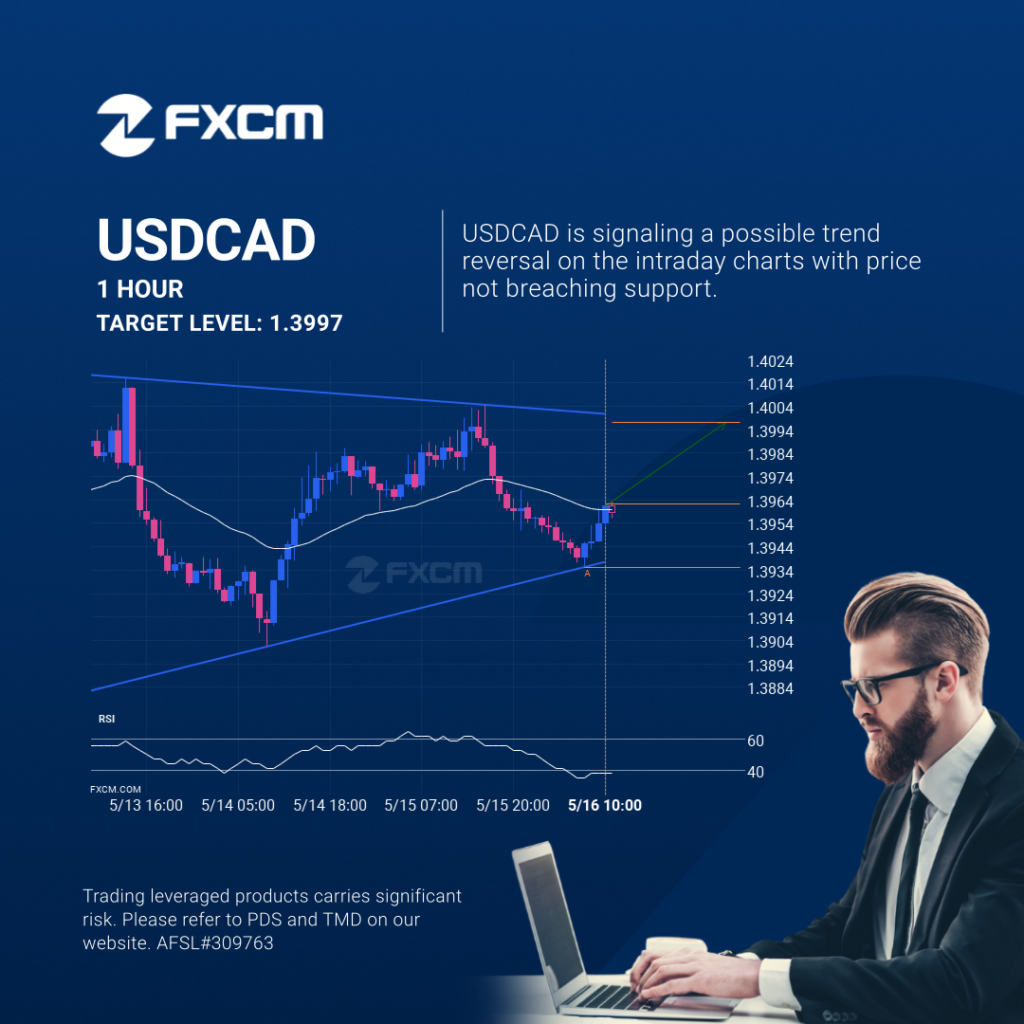
USDCAD is approaching the resistance line of a Triangle. It has touched this line numerous times in the last 5 days. If it tests this line again, it should do so in the next 21 hours. Past performance is not an indicator of future results. Trading leveraged products carries significant risk. Please refer to PDS […]
AUDUSD short term bullish trade setup to 0.6467
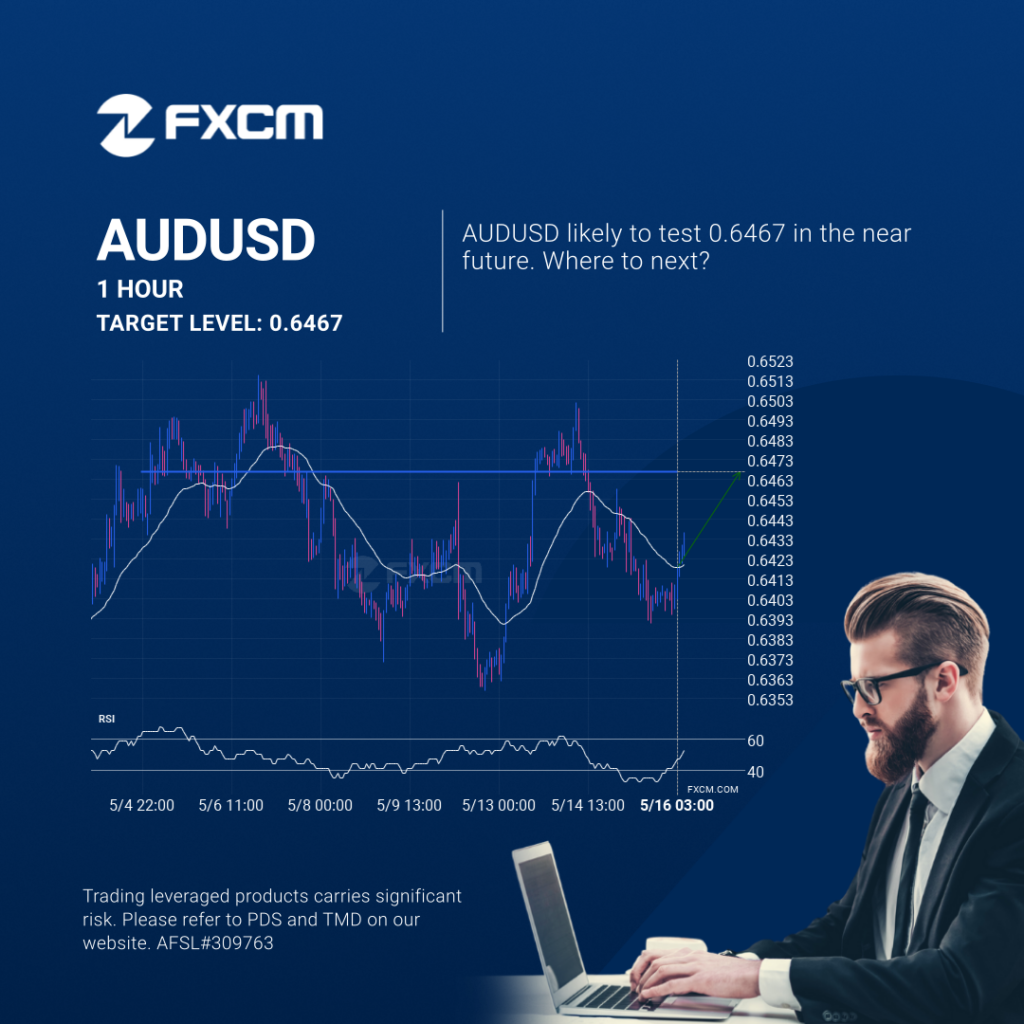
AUDUSD is moving towards a key resistance level at 0.6467. This is a previously tested level for AUDUSD. This could be a good trading opportunity, either at the spot price, or after breaching this level. Past performance is not an indicator of future results. Trading leveraged products carries significant risk. Please refer to PDS and […]