Where is ESP35 moving to?
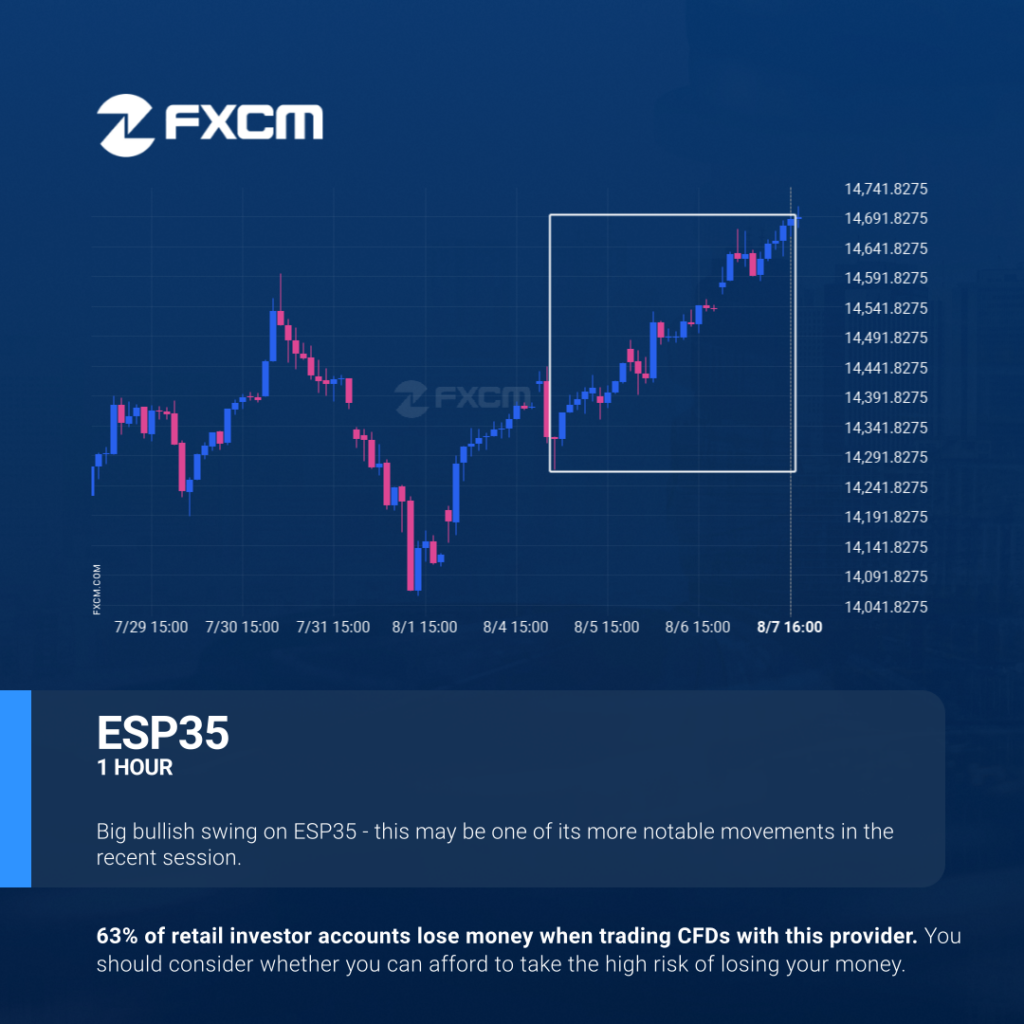
A movement of 2.57% over 3 days on ESP35 doesn’t go unnoticed. You may start considering where it’s heading next, a continuation of the current upward trend, or a reversal in the previous direction. Past performance is not an indicator of future results. Trading leveraged products carries significant risk. Please refer to PDS and TMD […]
BTCUSD: línea de resistencia rota a las 2025-08-07T10:00:00.000Z
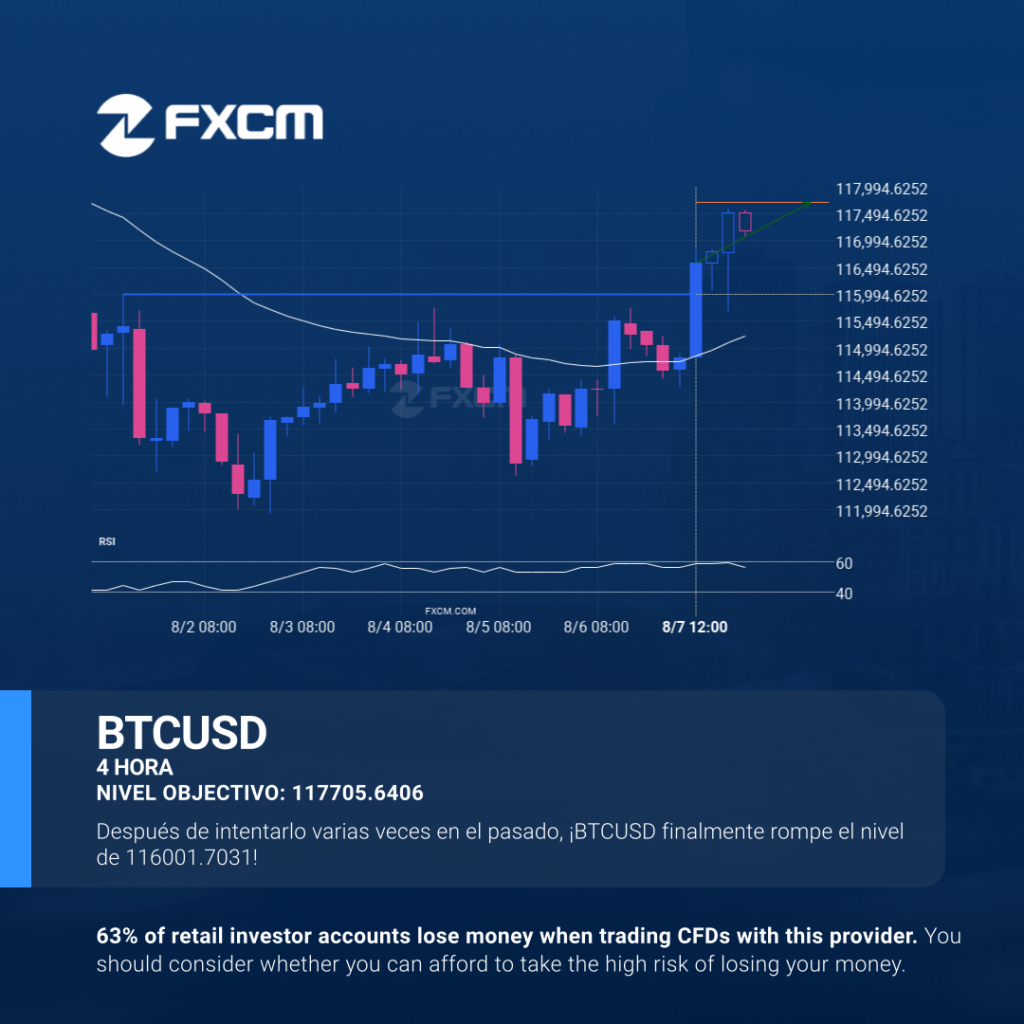
BTCUSD ha roto la línea de resistencia en 116001.7031. Puede continuar la tendencia alcista hacia 117705.6406 o puede resultar ser otro testeo más de este nivel. El rendimiento pasado no es indicativo de resultados futuros. Las pérdidas pueden exceder los fondos depositados.
Possible breach of resistance level by AUDUSD

Emerging Channel Up detected on AUDUSD – the pattern is an emerging one and has not yet broken through support, but the price is expected to move up over the next few hours. The price at the time the pattern was found was 0.65256 and it is expected to move to 0.6561. Past performance is […]
¿Hacia dónde se dirige ESP35?
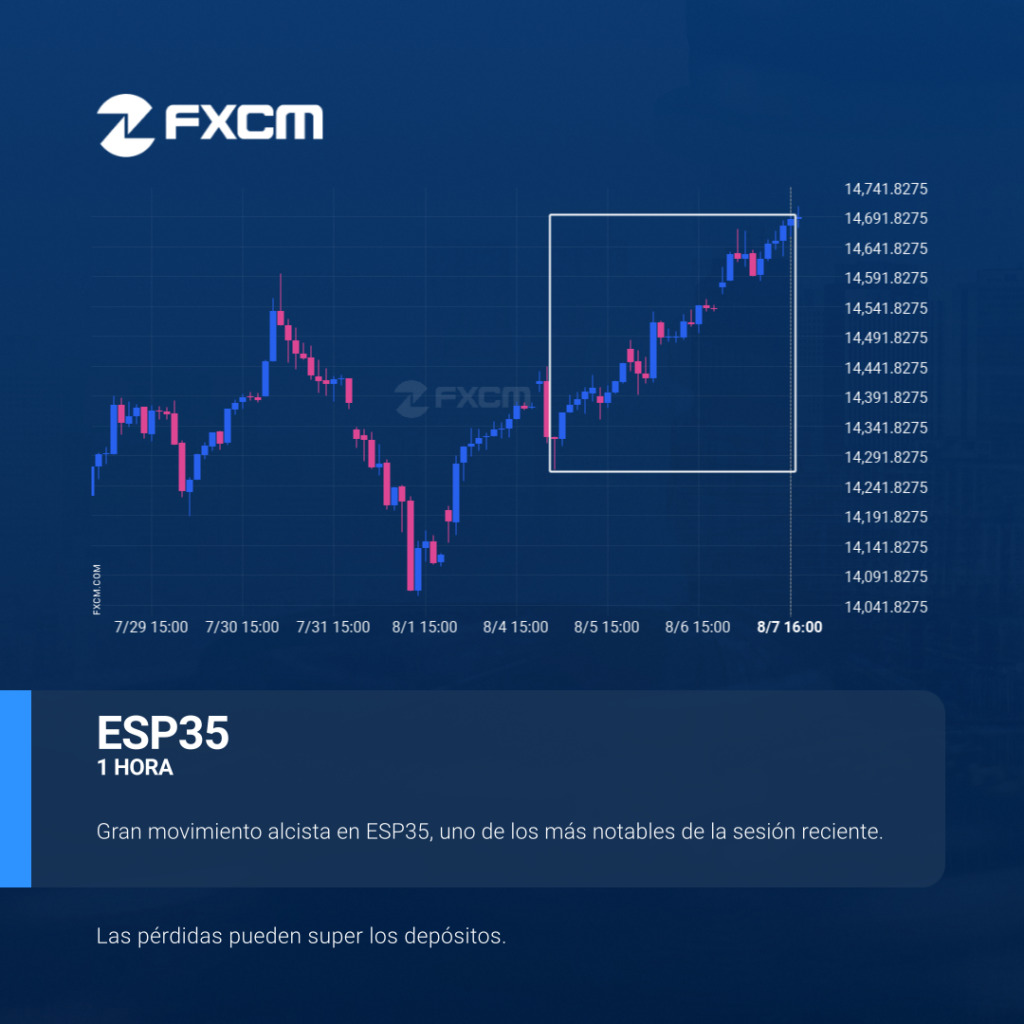
Un movimiento del 2,57% durante 3 días en ESP35 no pasa desapercibido. Podrías empezar a considerar hacia dónde se dirige ahora: si continuará la tendencia alcista o si se revertirá el movimiento previo. El rendimiento pasado no es indicativo de resultados futuros. Las pérdidas pueden exceder los fondos depositados.
¿Deberíamos esperar una ruptura o una recuperación del USDJPY?
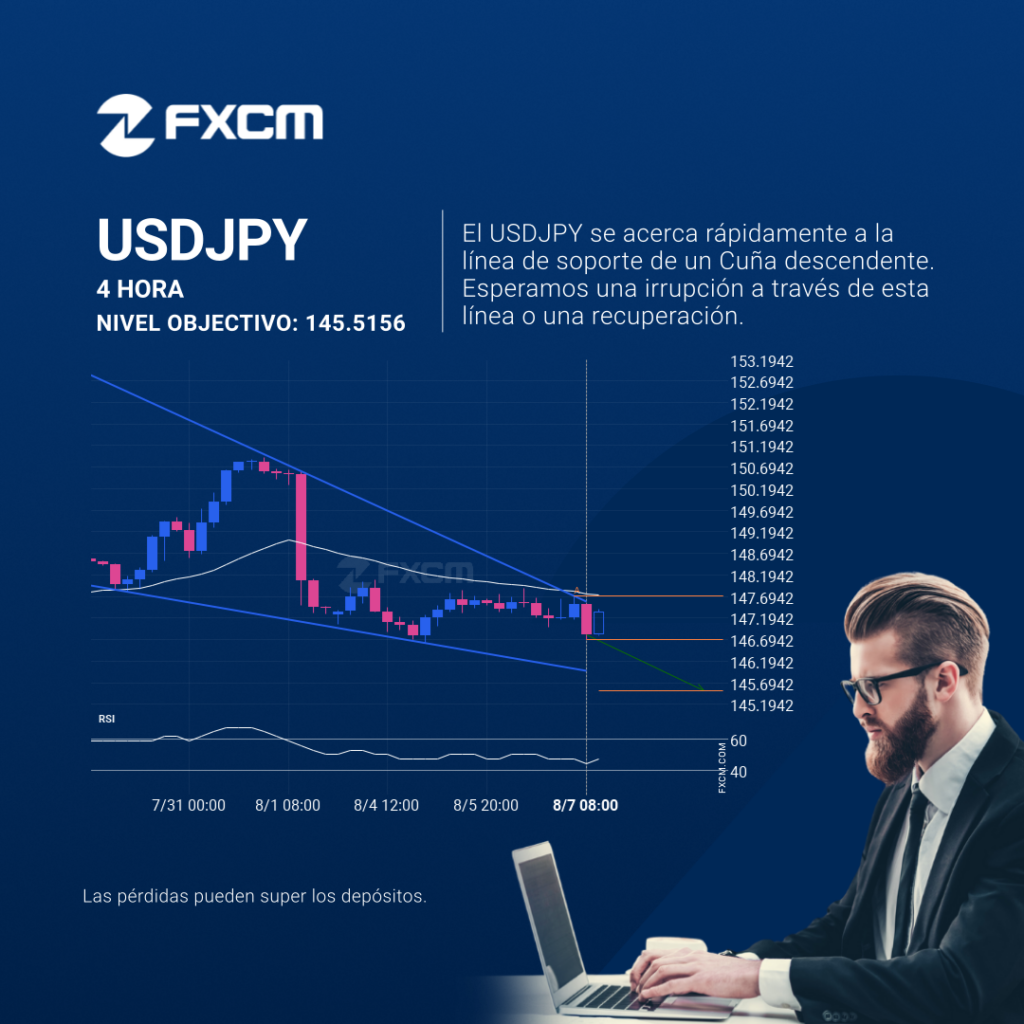
Se detectó un patrón de Cuña descendente emergente en USDJPY en el gráfico de 4 Hora. Hay un posible movimiento hacia 145.5156 en las próximas velas. Una vez que alcance el nivel de resistencia, puede continuar su movimiento bajista o retroceder a los niveles de precios actuales. El rendimiento pasado no es indicativo de resultados […]
Should we expect a breakout or a rebound on USDJPY?
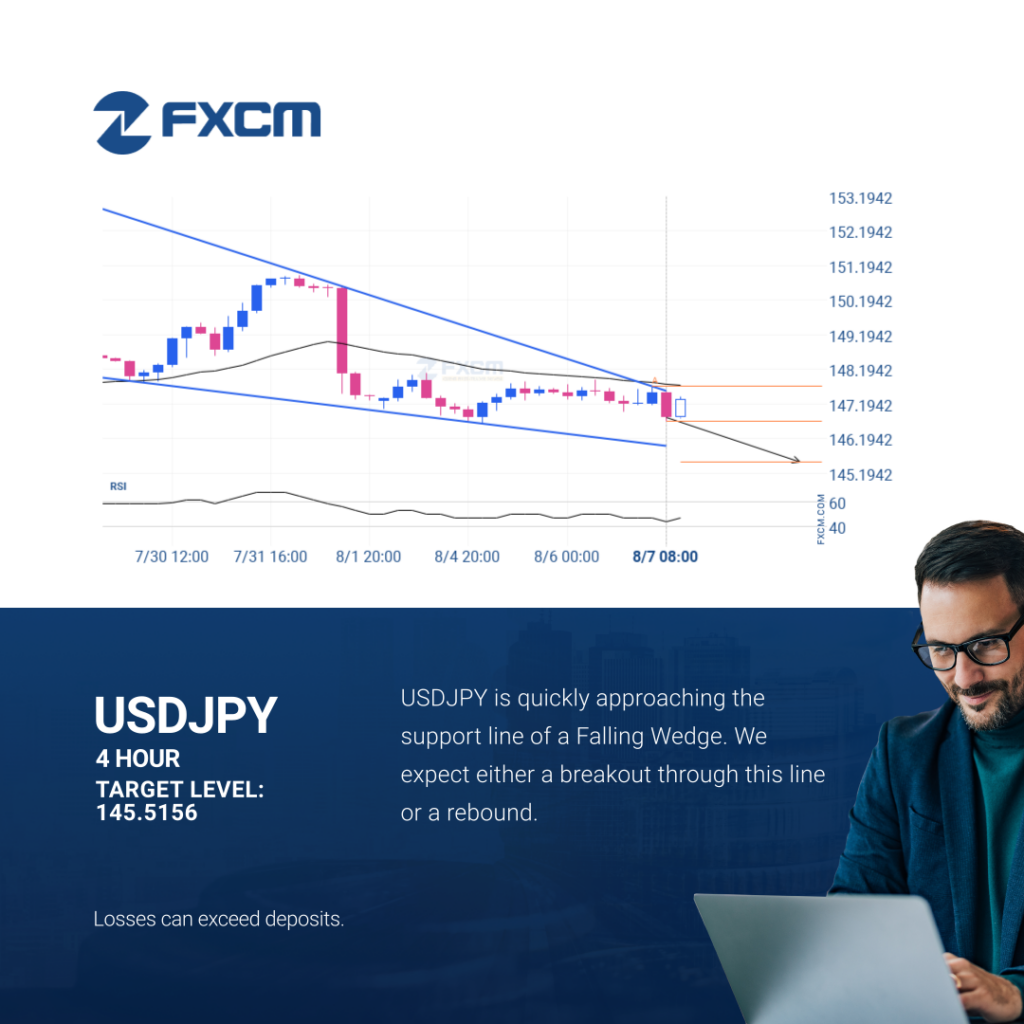
Emerging Falling Wedge pattern in its final wave was identified on the USDJPY 4 hour chart. After a strong bearish run, we find USDJPY heading towards the upper triangle line with a possible resistance at 145.5156. If the support shows to hold, the Falling Wedge pattern suggests a rebound back towards current levels. Past performance […]
USDCHF – Continuation Chart Pattern – Channel Down
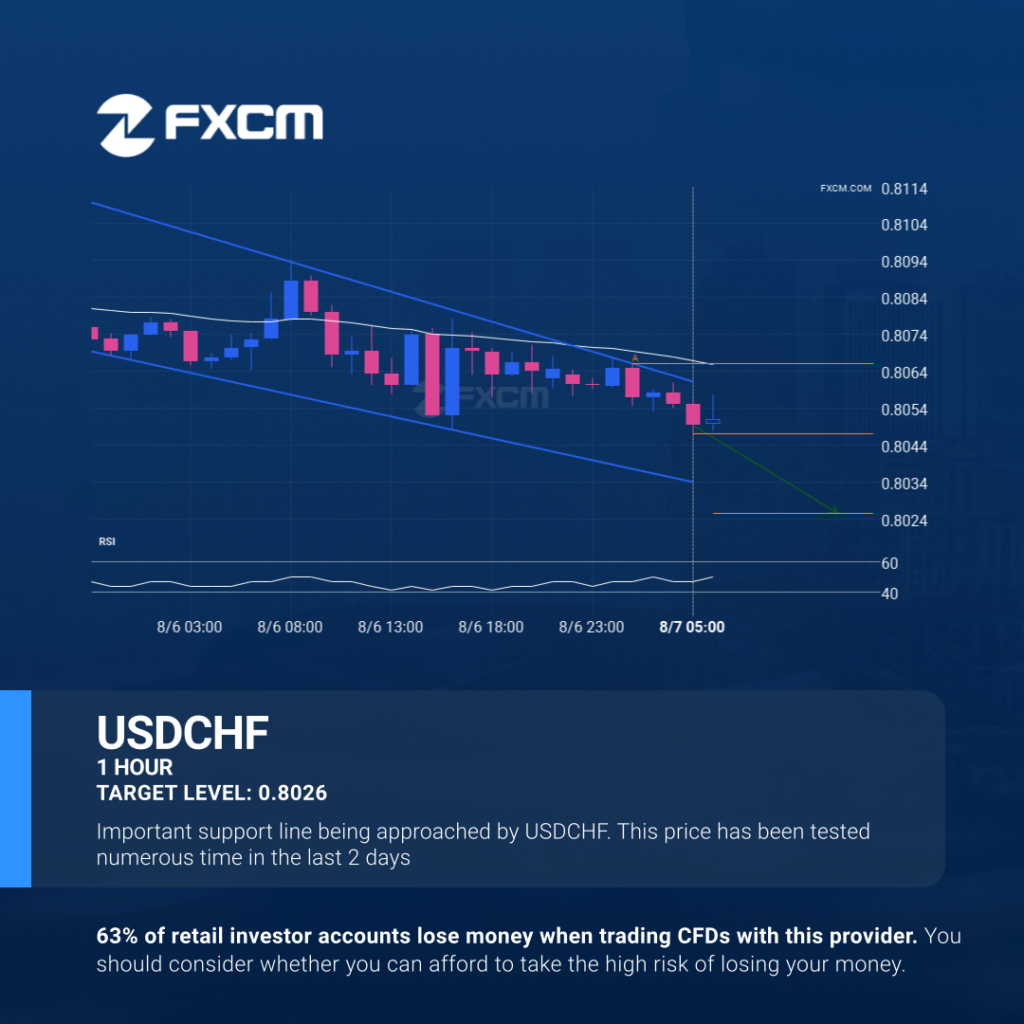
An emerging Channel Down has been detected on USDCHF on the 1 hour chart. There is a possible move towards 0.8026 next few candles. Once reaching resistance it may continue its bearish run or reverse back to current price levels. Past performance is not an indicator of future results. Trading leveraged products carries significant risk. […]
USDCHF – Continuation Chart Pattern – Channel Down
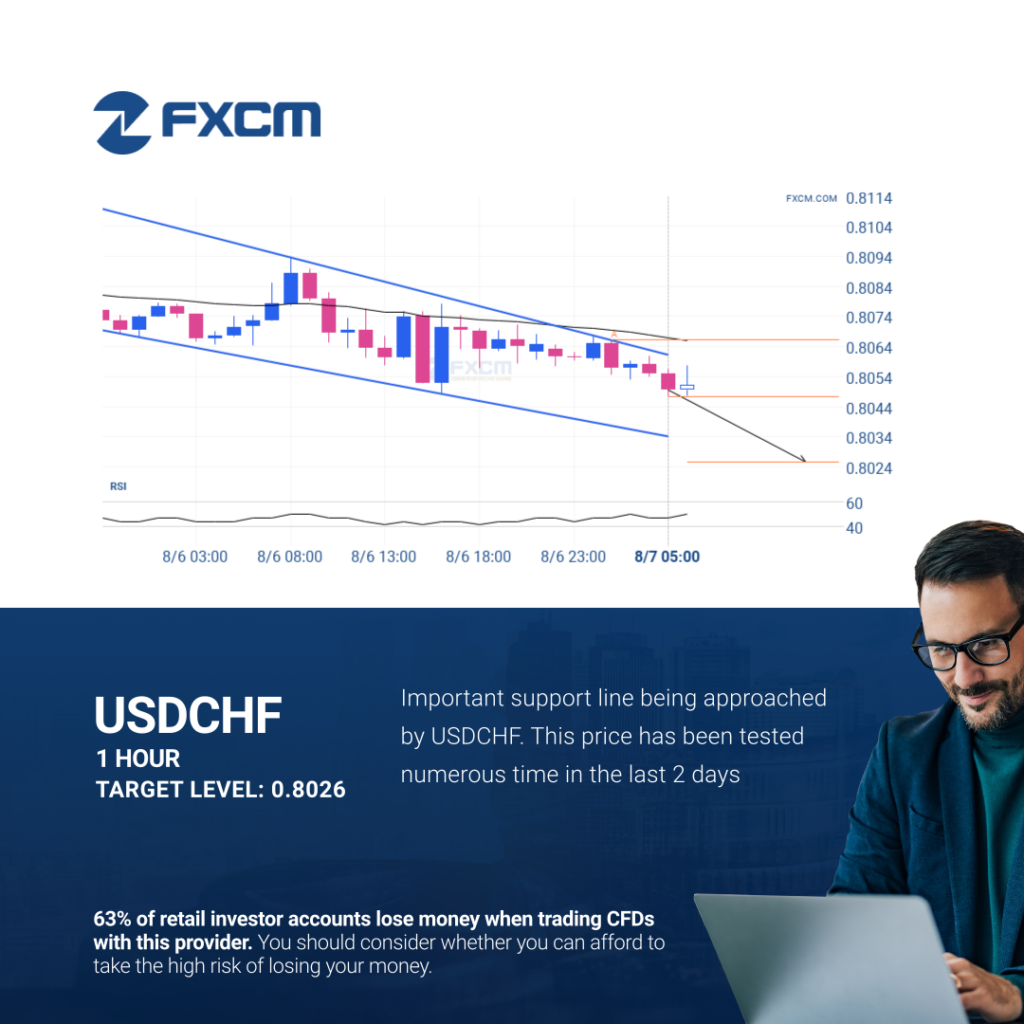
An emerging Channel Down has been detected on USDCHF on the 1 hour chart. There is a possible move towards 0.8026 next few candles. Once reaching resistance it may continue its bearish run or reverse back to current price levels. Past performance is not an indicator of future results. Trading leveraged products carries significant risk. […]
USDCHF – Continuation Patrón de gráfico – Canal bajista

Se ha detectado un patrón Canal bajista en formación en USDCHF en el gráfico de 1 Hora. Existe la posibilidad de un movimiento hacia 0.8026 en las próximas velas. Una vez que alcance resistance, el precio puede continuar su tendencia bajista o revertir a los niveles actuales de precio. El rendimiento pasado no es indicativo […]
USDCHF – Continuation Chart Pattern – Channel Down
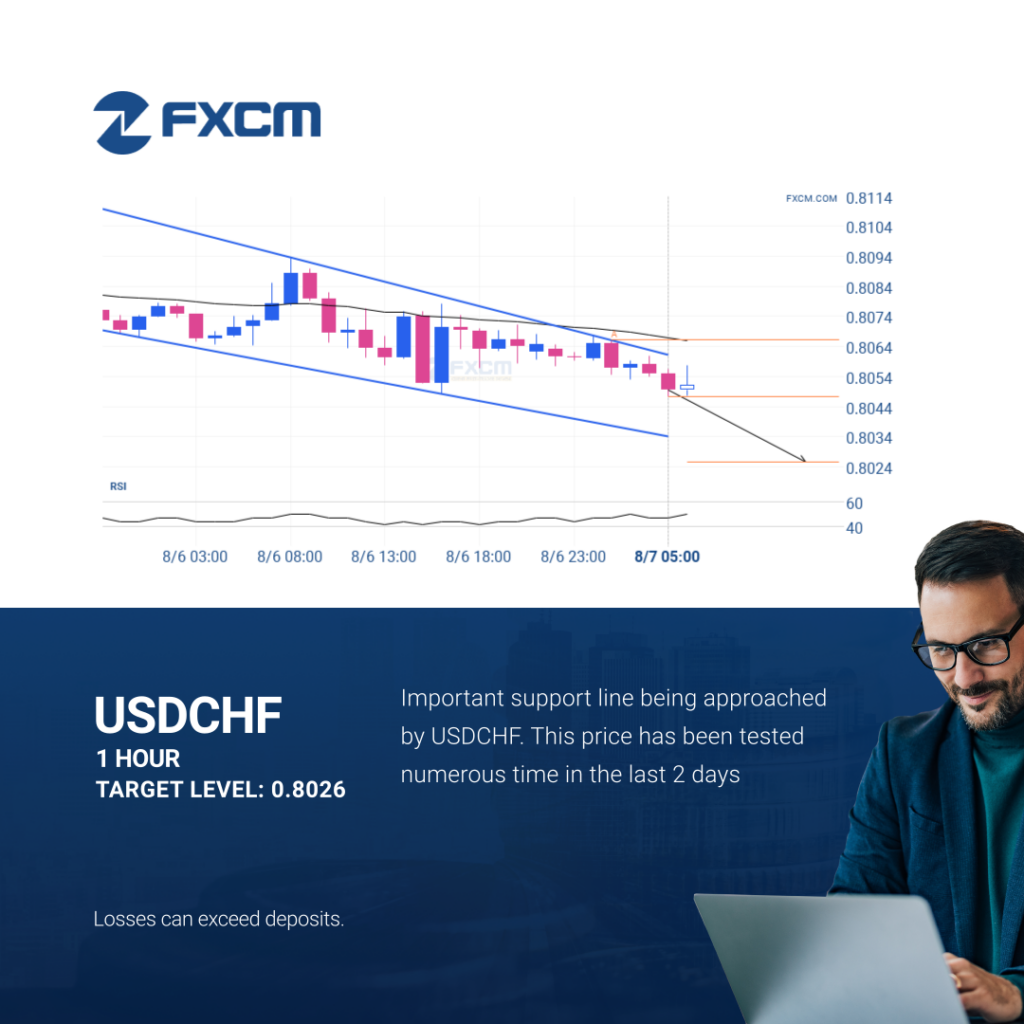
An emerging Channel Down has been detected on USDCHF on the 1 hour chart. There is a possible move towards 0.8026 next few candles. Once reaching resistance it may continue its bearish run or reverse back to current price levels. Past performance is not an indicator of future results. Losses can exceed deposits.