XAGUSD approaching support of a Channel Up

XAGUSD is approaching the support line of a Channel Up. It has touched this line numerous times in the last 10 days. If it tests this line again, it should do so in the next 2 days. Past performance is not an indicator of future results. Losses can exceed deposits.
ESP35 is on the approach

A strong resistance level has been identified at 14353.2100 on the 30 Minutes ESP35 chart. ESP35 is likely to test it soon. Past performance is not an indicator of future results. Losses can exceed deposits.
ESP35 se acerca

Se identificó un fuerte nivel de resistencia en 14353.2100 en el gráfico de 30 Minutos de ESP35. Es probable que ESP35 lo testee pronto. El rendimiento pasado no es indicativo de resultados futuros. Las pérdidas pueden exceder los fondos depositados.
ESP35 is on the approach

A strong resistance level has been identified at 14353.2100 on the 30 Minutes ESP35 chart. ESP35 is likely to test it soon. Past performance is not an indicator of future results. Trading leveraged products carries significant risk. Please refer to PDS and TMD on our website. AFSL#309763
AUDUSD short term bearish trade setup to 0.6383

AUDUSD is approaching a support line at 0.6383. If it hits the support line, it may break through this level to continue the bearish trend, or it may turn around back to current levels. Past performance is not an indicator of future results. Losses can exceed deposits.
AUDUSD short term bearish trade setup to 0.6383

AUDUSD is approaching a support line at 0.6383. If it hits the support line, it may break through this level to continue the bearish trend, or it may turn around back to current levels. Past performance is not an indicator of future results. Trading leveraged products carries significant risk. Please refer to PDS and TMD […]
AUDUSD: plan para operación bajista a corto plazo hasta 0.6383

AUDUSD se está acercando a una línea de soporte en 0.6383. Si llega a la línea de soporte, puede atravesar este nivel para continuar con la tendencia bajista, o puede girarse y volver a los niveles actuales. El rendimiento pasado no es indicativo de resultados futuros. Las pérdidas pueden exceder los fondos depositados.
Cambio dramático en BTCUSD. ¿Una muestra de lo que vendrá?

Se ha producido un gran movimiento inesperado en el gráfico de Diario de BTCUSD que comienza en 79143.06 y finaliza en 109699.86. ¿Es esto una señal de algo nuevo? ¿Qué podemos esperar en el futuro? El rendimiento pasado no es indicativo de resultados futuros. Las pérdidas pueden exceder los fondos depositados.
Importante línea de precio atravesada por el EURJPY

El EURJPY ha atravesado 162.3915, que ha probado ya varias veces en el pasado. Ya hemos visto un retroceso de esta posición en numerosas ocasiones. Si esta nueva tendencia persiste, EURJPY podría dirigirse al nivel 161.9438 dentro de las próximas 2 días. El rendimiento pasado no es indicativo de resultados futuros. Las pérdidas pueden exceder […]
Important price line breached by EURJPY
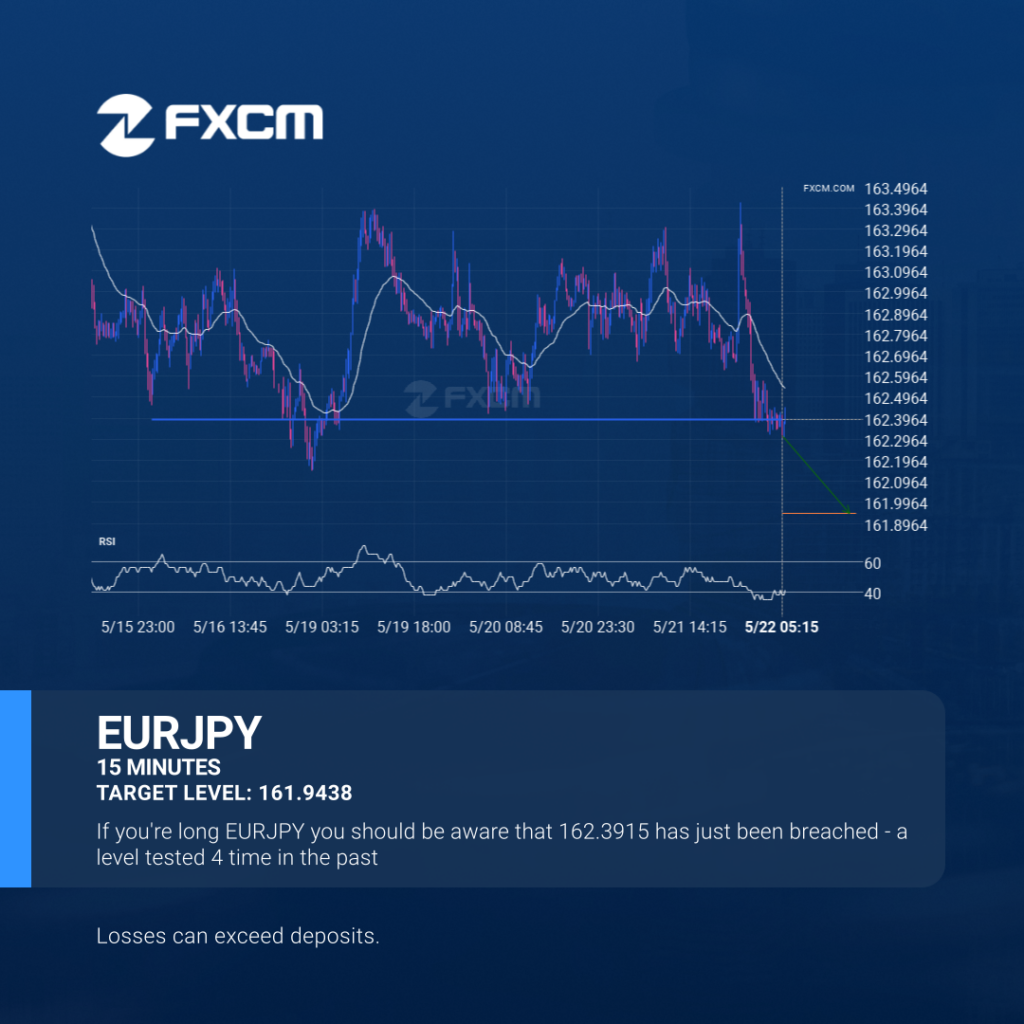
EURJPY has broken through 162.3915 which it has tested numerous times in the past. We have seen it retrace from this price in the past. If this new trend persists, EURJPY may be heading towards 161.9438 within the next 2 days. Past performance is not an indicator of future results. Losses can exceed deposits.