GBPUSD approaching resistance of a Rising Wedge
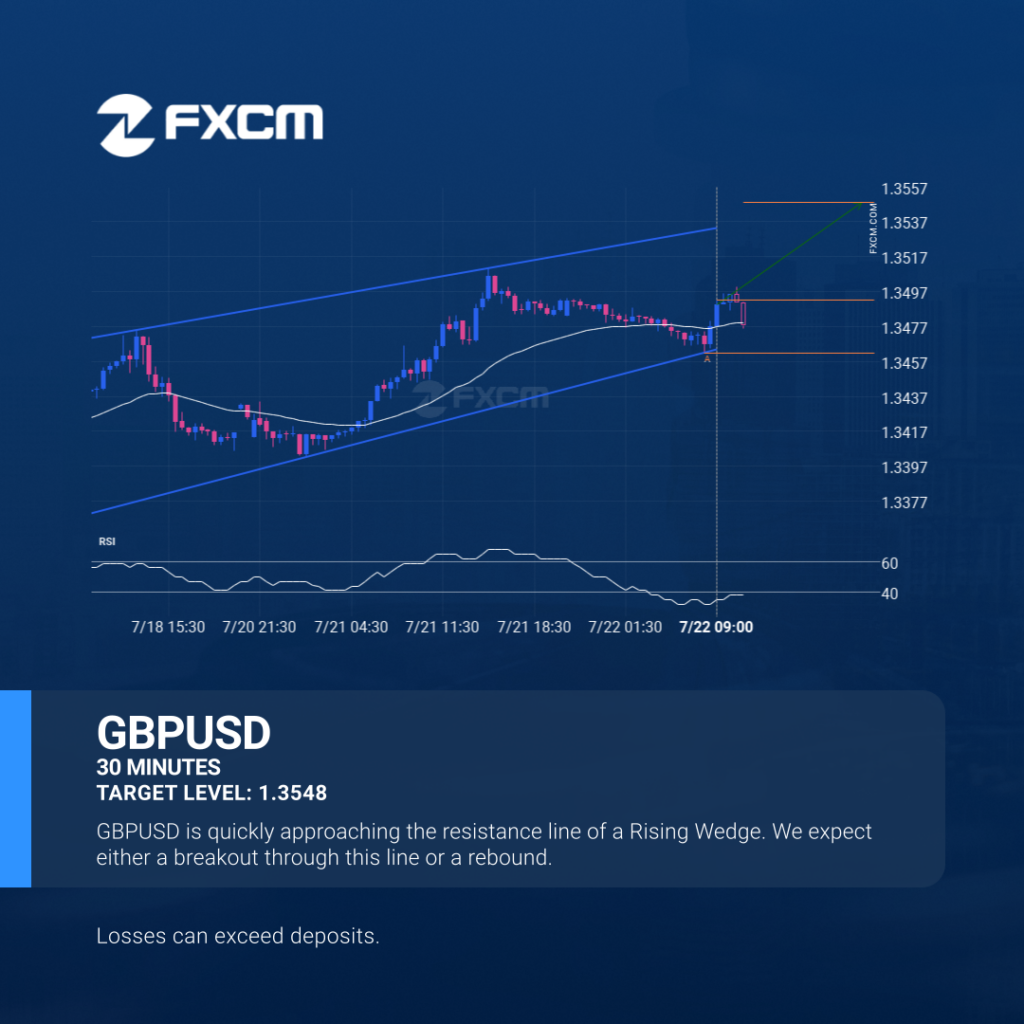
GBPUSD is heading towards the resistance line of a Rising Wedge and could reach this point within the next 12 hours. It has tested this line numerous times in the past, and this time could be no different from the past, ending in a rebound instead of a breakout. If the breakout doesn’t happen, we […]
Un posible movimiento alcista en BTCUSD
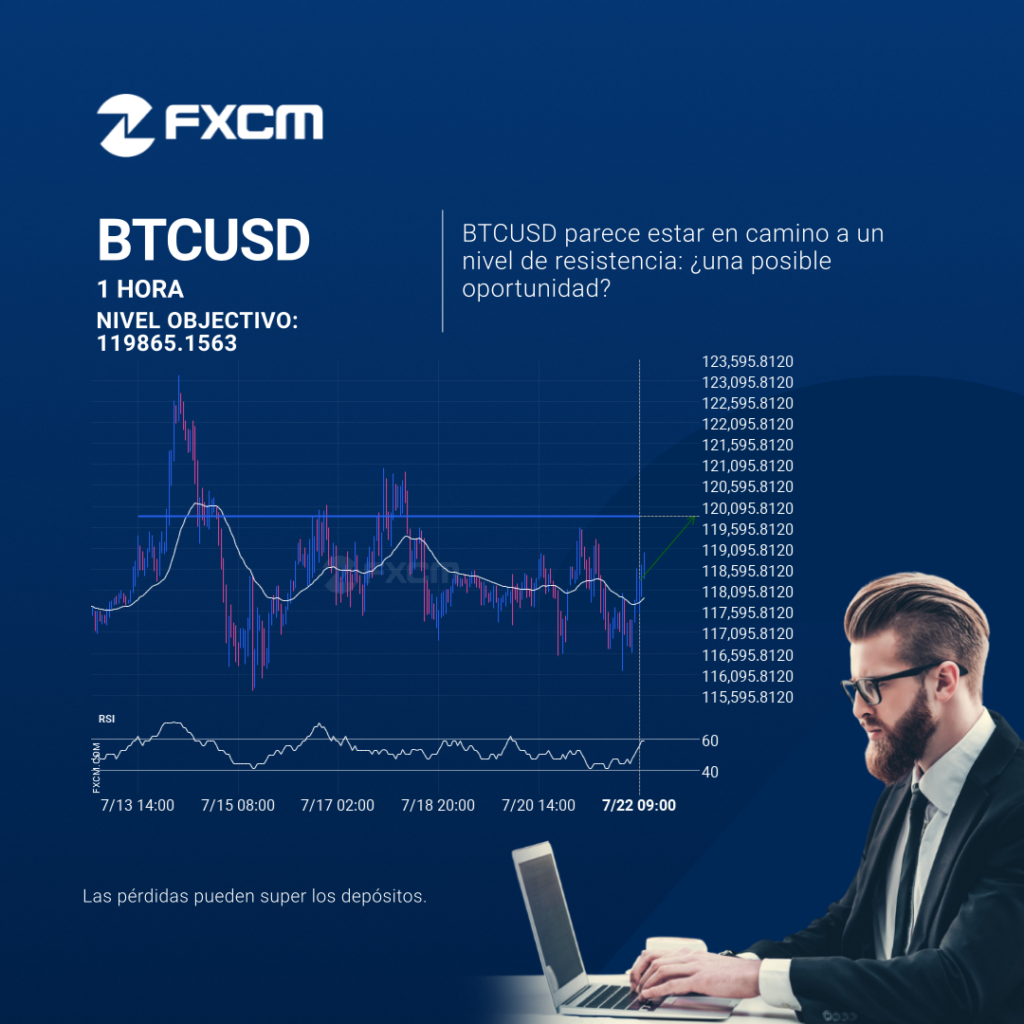
El BTCUSD avanza hacia la línea de resistencia de un Resistencia. Como lo hemos observado retrocediendo desde este nivel en el pasado, podríamos observar, o bien una ruptura a través de esta línea o una recuperación de nuevo a los niveles actuales. Ya ha llegado a dicha línea en numerosas ocasiones durante los últimos 9 […]
EURCHF – getting close to resistance of a Channel Up
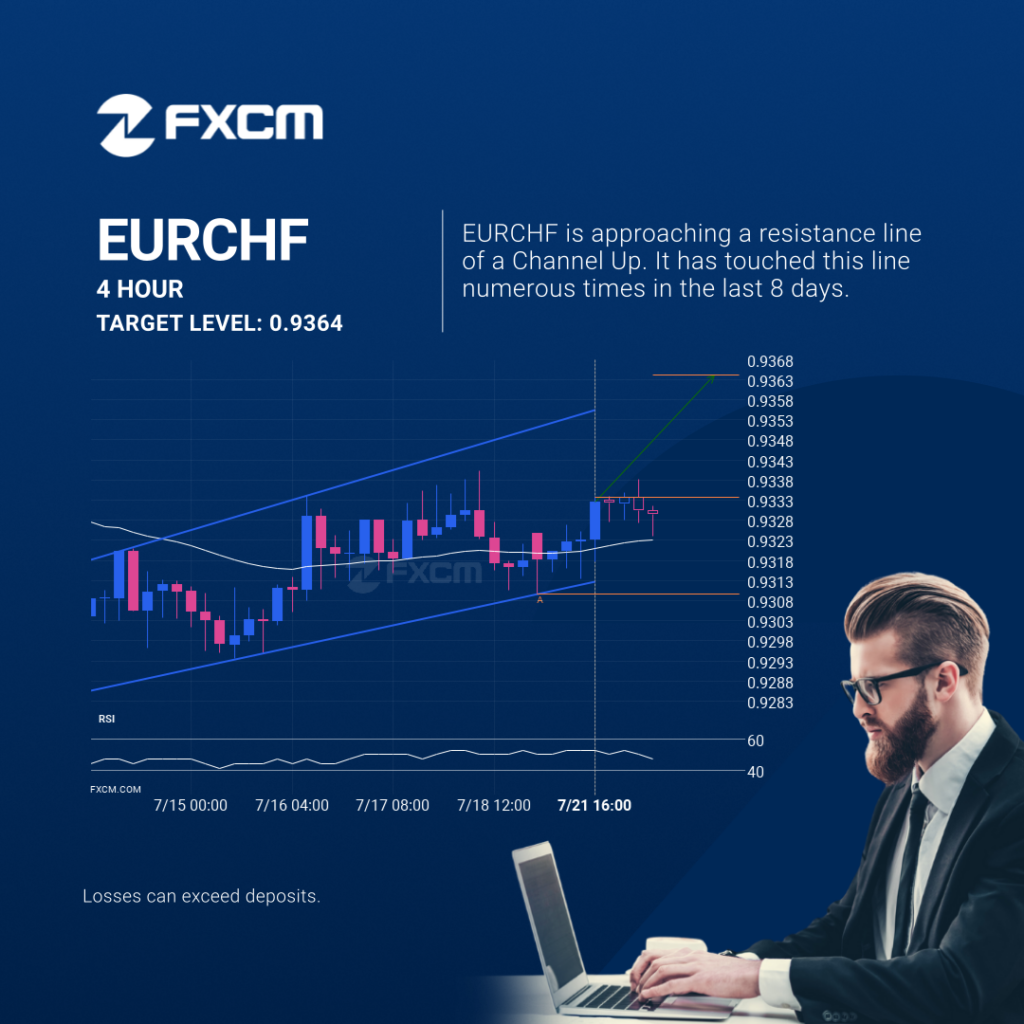
EURCHF is approaching the resistance line of a Channel Up. It has touched this line numerous times in the last 8 days. If it tests this line again, it should do so in the next 2 days. Past performance is not an indicator of future results. Losses can exceed deposits.
EURCHF – acercándose a la resistencia del Canal alcista
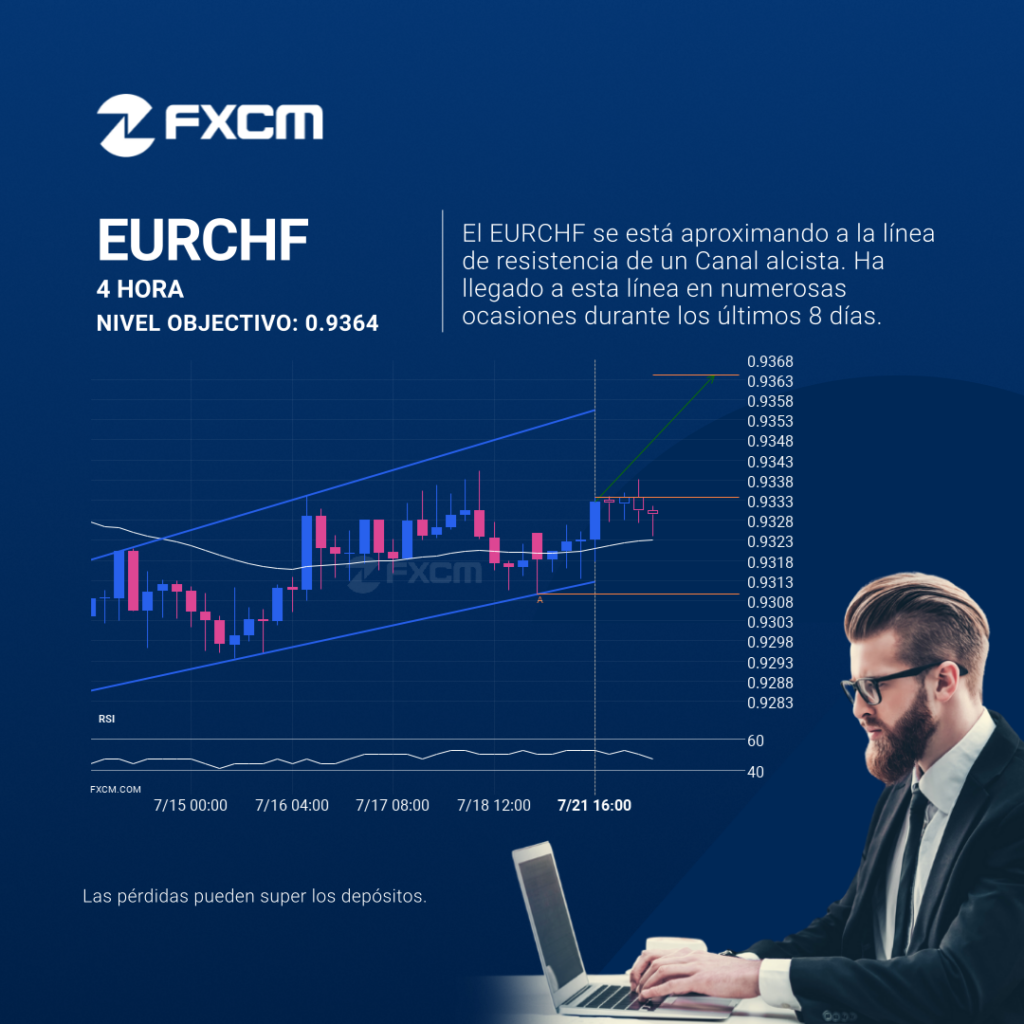
El EURCHF se está acercando a la línea de resistencia de un Canal alcista. Ha llegado a esta línea en numerosas ocasiones durante los últimos 8 días. Si vuelve a probarla de nuevo, debería hacerlo en las próximas 2 días. El rendimiento pasado no es indicativo de resultados futuros. Las pérdidas pueden exceder los fondos […]
Either a rebound or a breakout imminent on ESP35
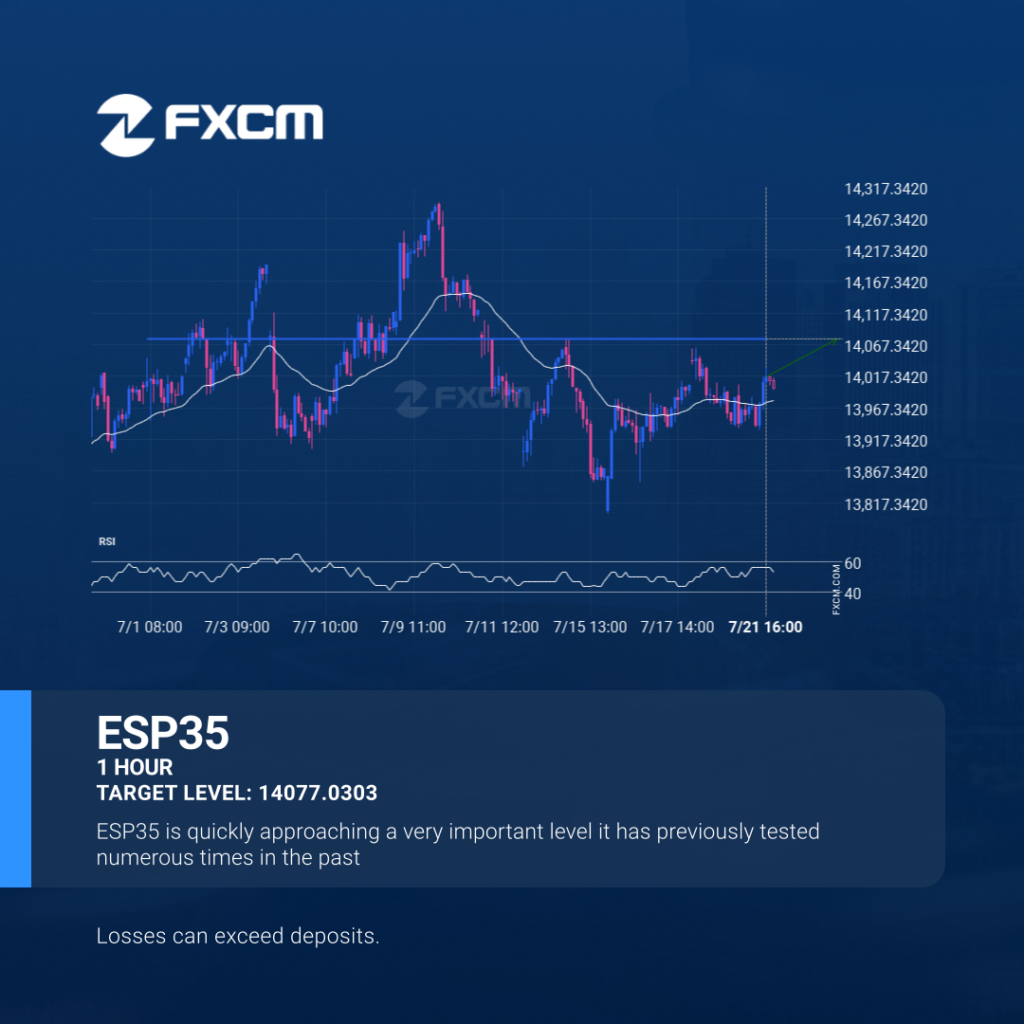
A strong resistance level has been identified at 14077.0303 on the 1 hour ESP35 chart. ESP35 is likely to test it soon. Past performance is not an indicator of future results. Losses can exceed deposits.
O bien, una inminente recuperación o una ruptura del ESP35
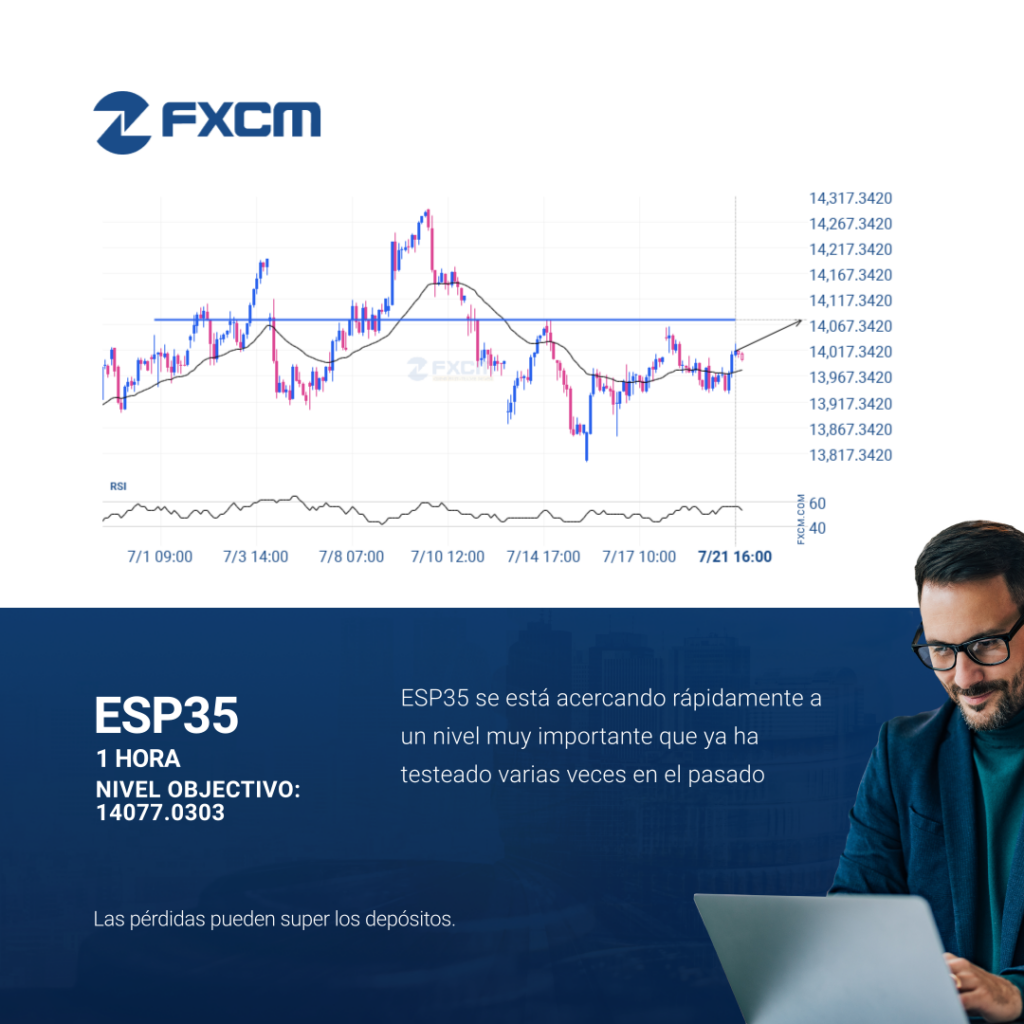
Se identificó un fuerte nivel de resistencia en 14077.0303 en el gráfico de 1 Hora de ESP35. Es probable que ESP35 lo testee pronto. El rendimiento pasado no es indicativo de resultados futuros. Las pérdidas pueden exceder los fondos depositados.
Either a rebound or a breakout imminent on ESP35
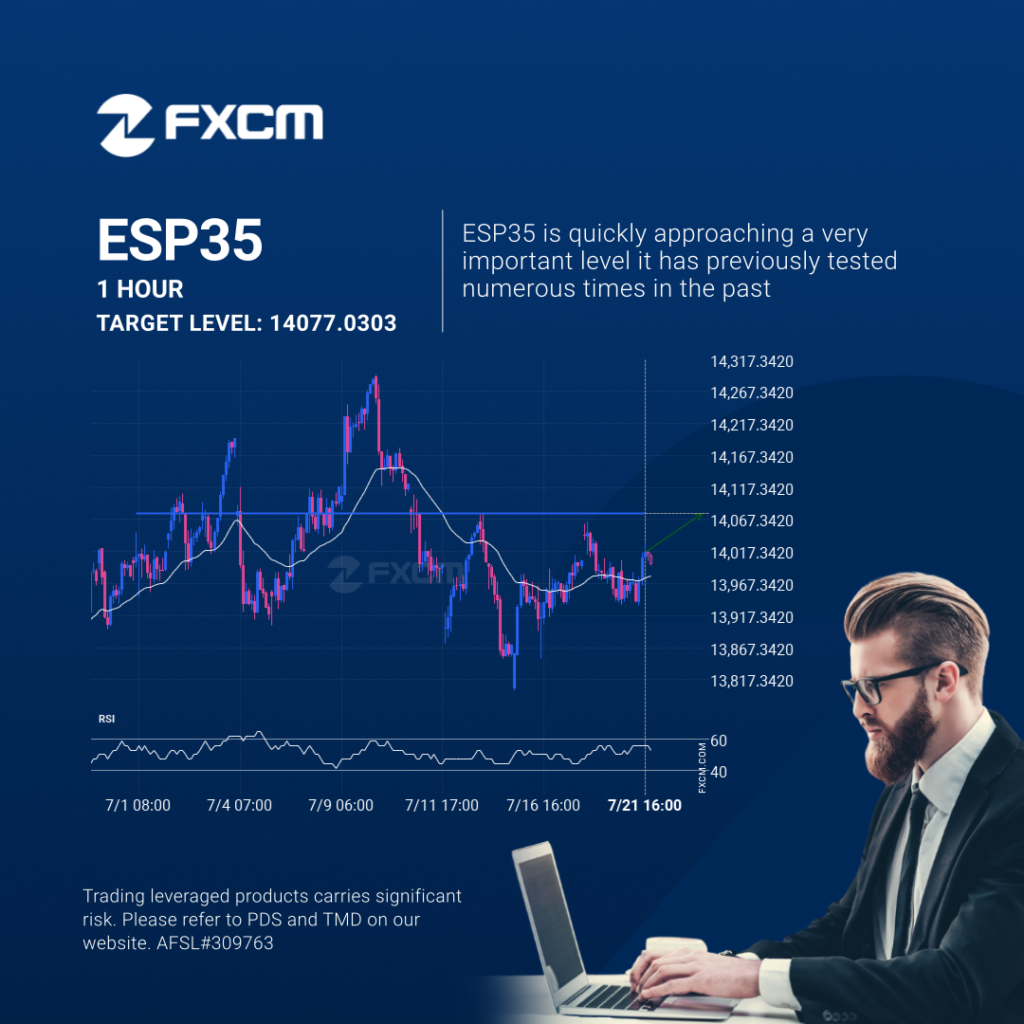
A strong resistance level has been identified at 14077.0303 on the 1 hour ESP35 chart. ESP35 is likely to test it soon. Past performance is not an indicator of future results. Trading leveraged products carries significant risk. Please refer to PDS and TMD on our website. AFSL#309763
Se espera la posibilidad de un gran movimiento en el USDJPY
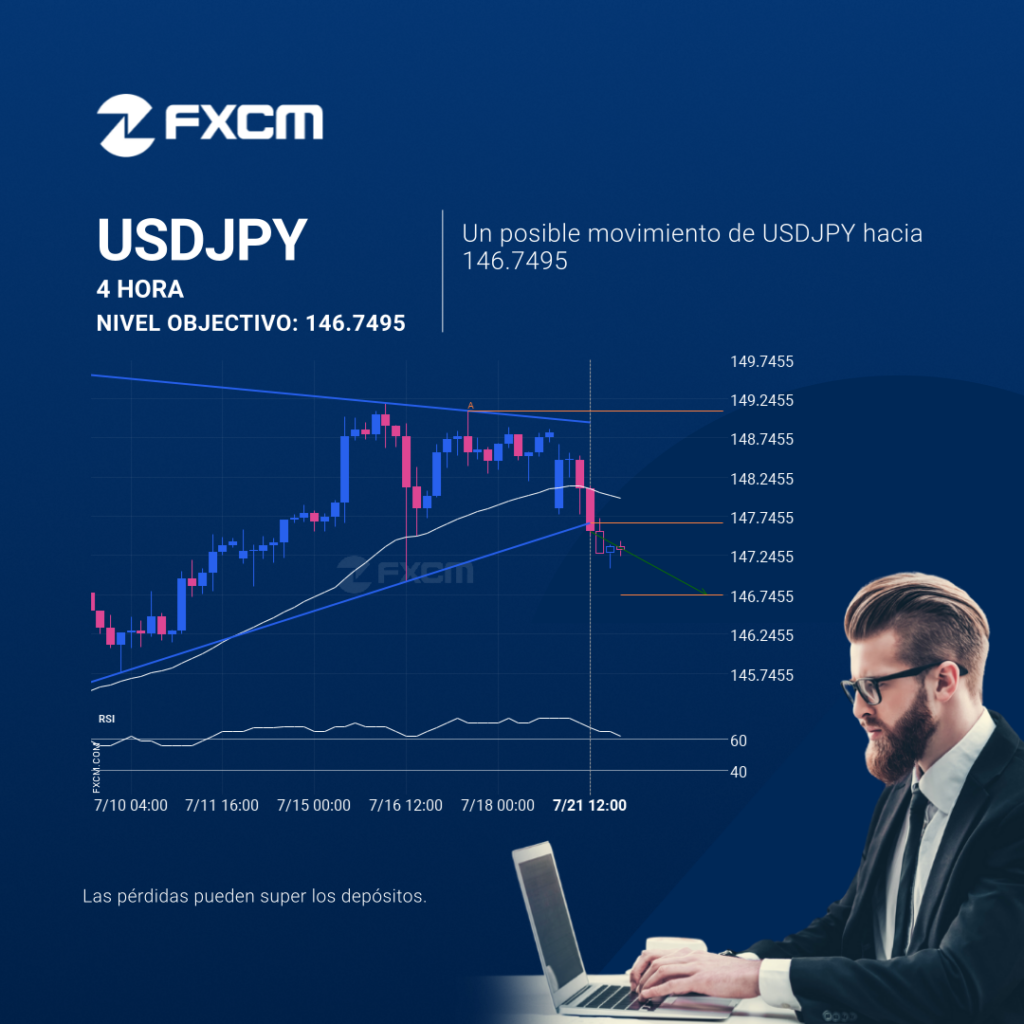
La irrupción del USDJPY a través de la línea de soporte de un Triángulo podría ser una señal de la ruta a seguir. Si esta irrupción persiste, podríamos ver el USDJPY probando el nivel de 146.7495 dentro de las próximas 2 días. El rendimiento pasado no es indicativo de resultados futuros. Las pérdidas pueden exceder […]
Possibility of big movement expected on USDJPY
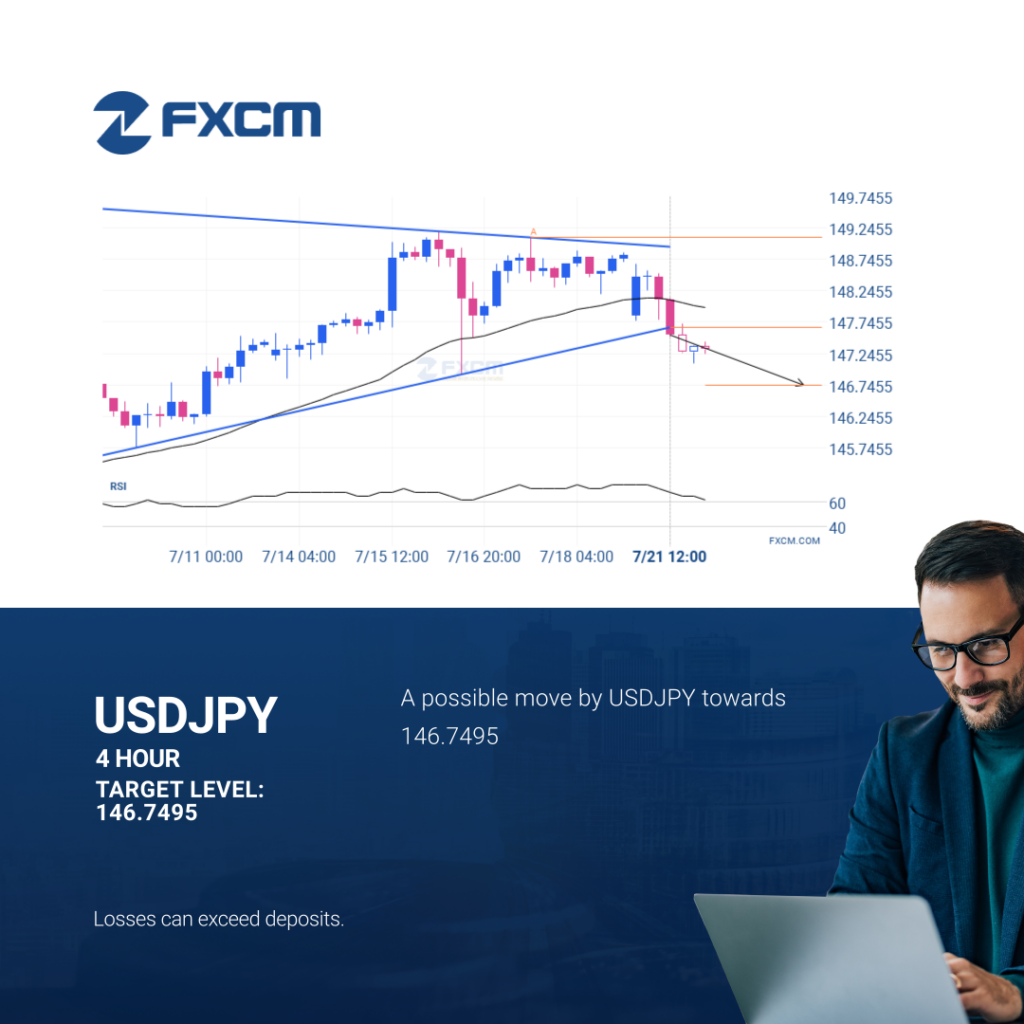
The breakout of USDJPY through the support line of a Triangle could be a sign of the road ahead. If this breakout persists, we may see the price of USDJPY testing 146.7495 within the next 2 days. Past performance is not an indicator of future results. Losses can exceed deposits.
GBPUSD approaching resistance of a Triangle
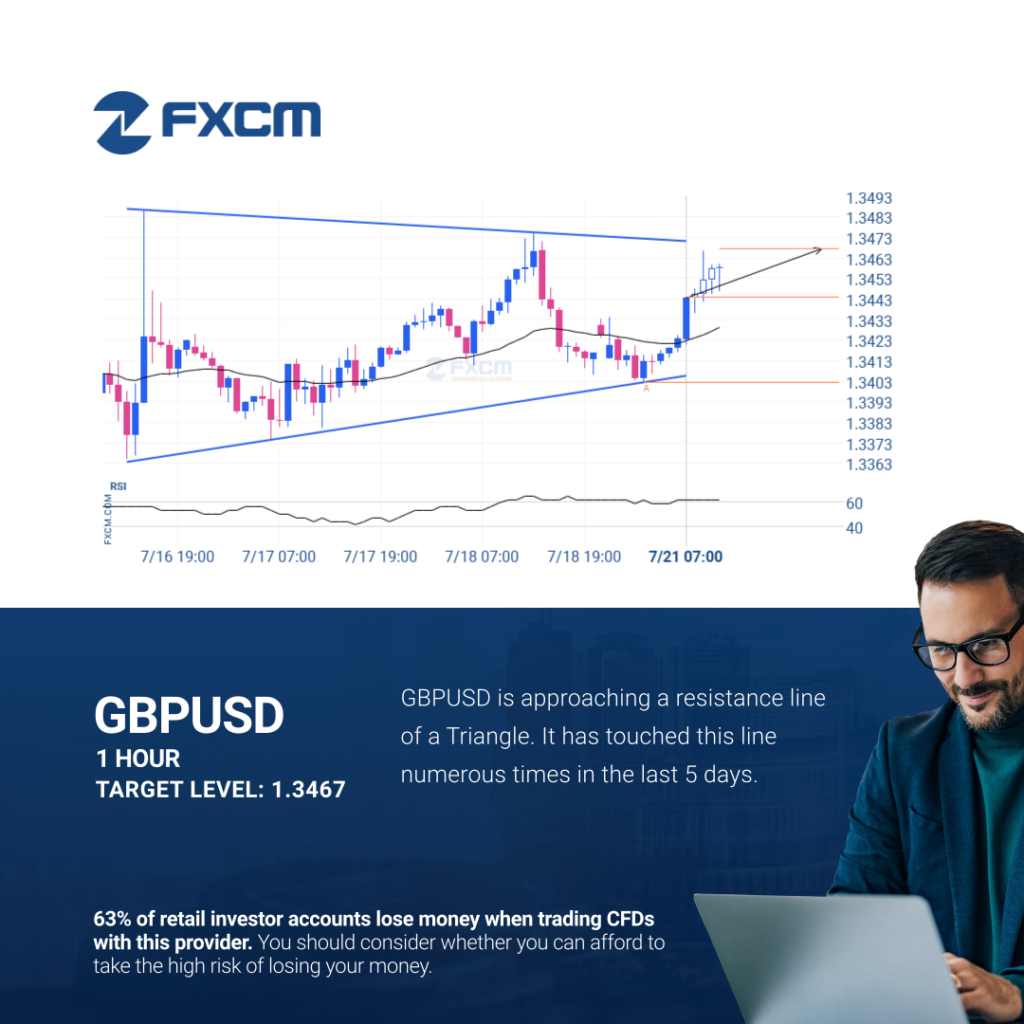
The movement of GBPUSD towards the resistance line of a Triangle is yet another test of the line it reached numerous times in the past. This line test could happen in the next 16 hours, but it is uncertain whether it will result in a breakout through this line, or simply rebound back to current […]