ESP35 – psychological price line breached

The breakout of ESP35 through the 13957.0195 price line is a breach of an important psychological price that is has tested numerous in the past. If this breakout persists, ESP35 could test 13870.3389 within the next 11 hours. One should always be cautious before placing a trade, wait for confirmation of the breakout. Past performance […]
ESP35 – línea de precio psicológico atravesada

La rotura del ESP35 a través de la línea de precio en 13957.0195 es una brecha de un importante precio psicológico que se ha probado numerosas veces en el pasado. Si esta rotura persiste, el ESP35 podría probar el nivel de 13870.3389 durante las siguientes 11 horas. Habría que ser prudentes antes de ejecutar una […]
Breach of important price line imminent by EURGBP
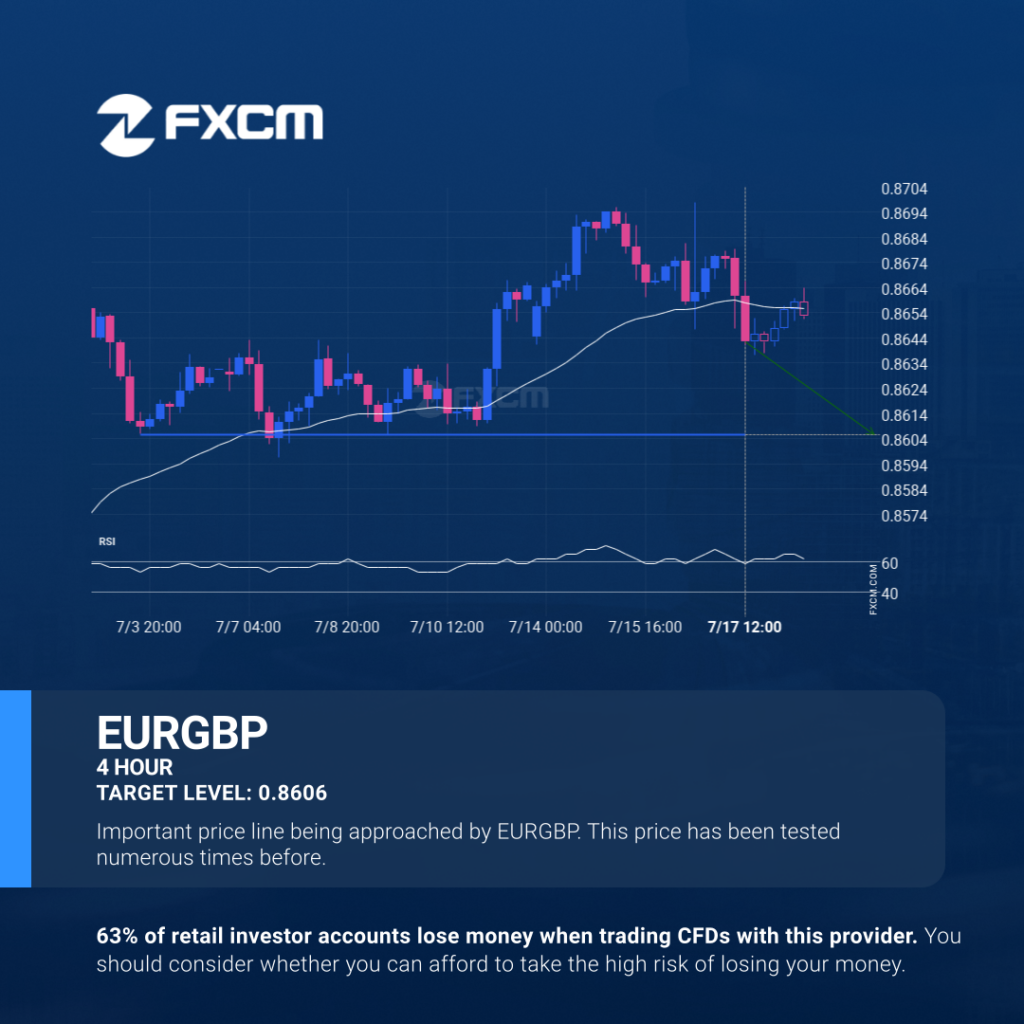
The movement of EURGBP towards 0.8606 price line is yet another test of the line it reached numerous times in the past. We could expect this test to happen in the next 2 days, but it is uncertain whether it will result in a breakout through this line, or simply rebound back to current lines. […]
Inminente irrupción de una importante línea de precio del EURGBP

El movimiento del EURGBP hacia la línea de precio 0.8606 es otra prueba más de la línea que ha alcanzado en numerosas ocasiones durante el pasado. Podríamos esperar que esta prueba ocurra en las próximas 2 días, pero no sabemos si dará como resultado una irrupción a través de esta línea o simplemente una recuperación […]
Breach of important price line imminent by EURGBP

The movement of EURGBP towards 0.8606 price line is yet another test of the line it reached numerous times in the past. We could expect this test to happen in the next 2 days, but it is uncertain whether it will result in a breakout through this line, or simply rebound back to current lines. […]
BTCUSD acercándose a nivel de soporte

BTCUSD se está moviendo hacia un nivel clave de soporte en 117573.4531. BTCUSD testeó previamente este nivel 3 veces y en cada ocasión rebotó en este nivel. ¿Ha llegado finalmente el momento de la rotura? El rendimiento pasado no es indicativo de resultados futuros. Las pérdidas pueden exceder los fondos depositados.
Breach of important price line imminent by EURGBP

The movement of EURGBP towards 0.8606 price line is yet another test of the line it reached numerous times in the past. We could expect this test to happen in the next 2 days, but it is uncertain whether it will result in a breakout through this line, or simply rebound back to current lines. […]
ESP35 se acerca a un nivel importante en 13927.7803

ESP35 se está acercando a una línea de soporte en 13927.7803. Si llega a la línea de soporte, puede atravesar este nivel para continuar con la tendencia bajista, o puede girarse y volver a los niveles actuales. El rendimiento pasado no es indicativo de resultados futuros. Las pérdidas pueden exceder los fondos depositados.
ESP35 approaching important level of 13927.7803

ESP35 is approaching a support line at 13927.7803. If it hits the support line, it may break through this level to continue the bearish trend, or it may turn around back to current levels. Past performance is not an indicator of future results. Trading leveraged products carries significant risk. Please refer to PDS and TMD […]
ESP35 approaching important level of 13927.7803

ESP35 is approaching a support line at 13927.7803. If it hits the support line, it may break through this level to continue the bearish trend, or it may turn around back to current levels. Past performance is not an indicator of future results. Losses can exceed deposits.