Breach of important price line imminent by HKG33
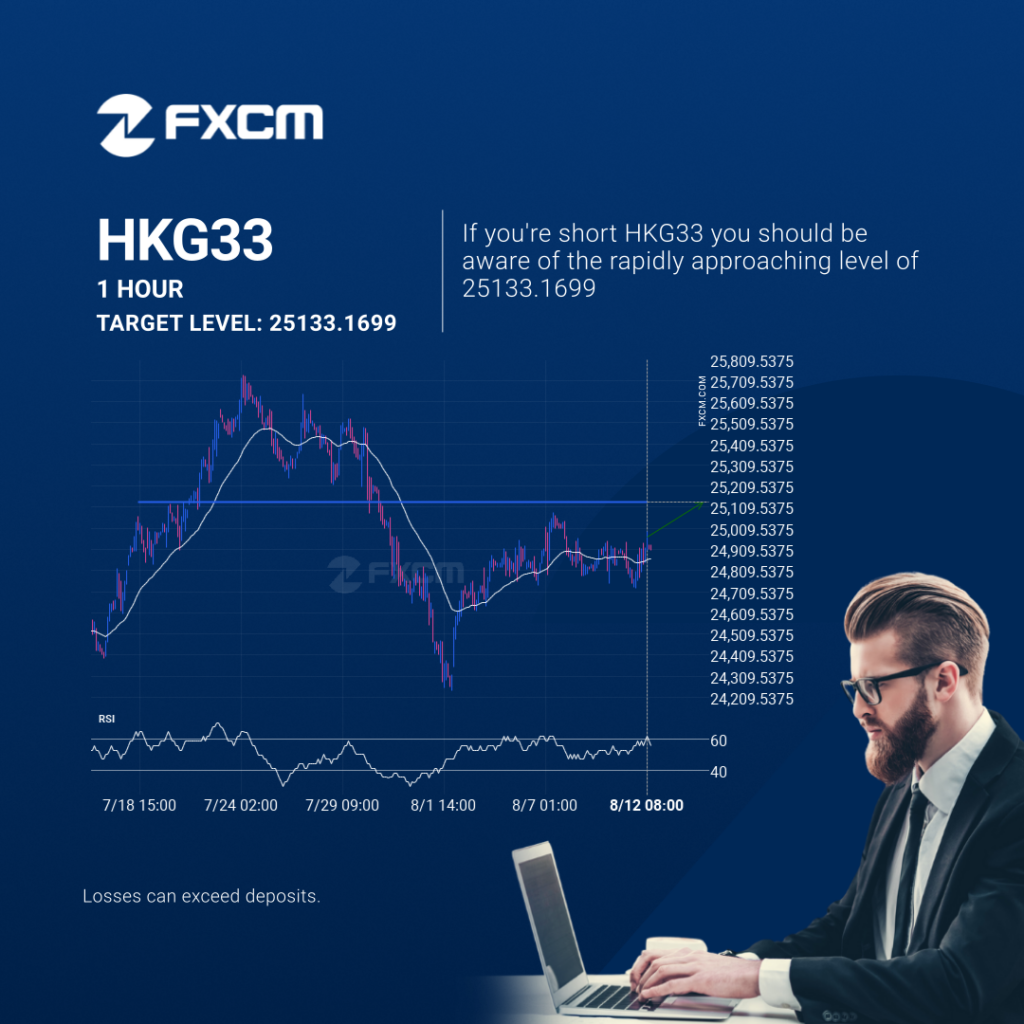
HKG33 is heading towards a line of 25133.1699. If this movement continues, the price of HKG33 could test 25133.1699 within the next 3 days. But don’t be so quick to trade, it has tested this line numerous times in the past, so this movement could be short-lived and end up rebounding. Past performance is not […]
Inminente irrupción de una importante línea de precio del HKG33

El HKG33 avanza hacia la línea de 25133.1699. Si este movimiento se mantiene, el precio del HKG33 podría probar el nivel de 25133.1699 en un plazo de 3 días. Pero no se apresure a la hora de operar, porque el par ha probado esta línea en numerosas ocasiones durante el pasado, por lo que este […]
Either a rebound or a breakout imminent on EURCHF
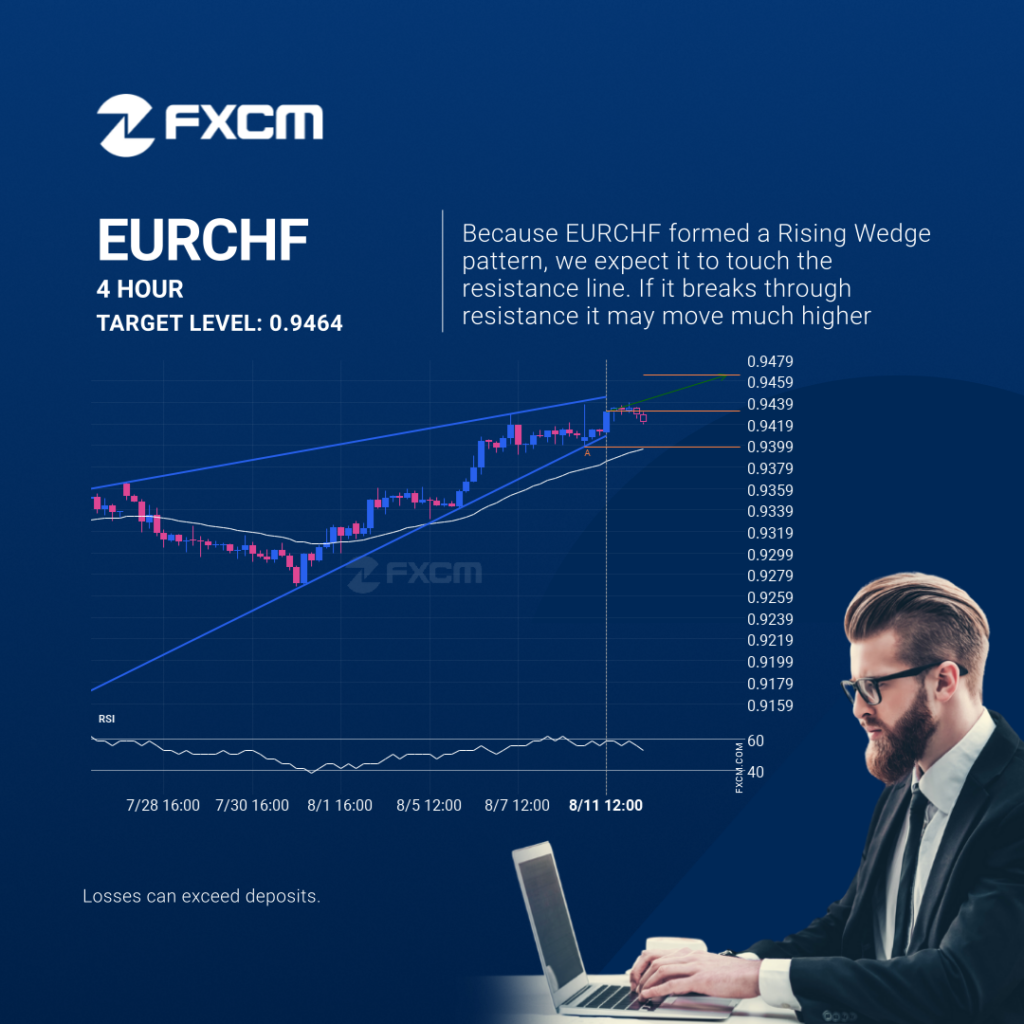
A Rising Wedge pattern was identified on EURCHF at 0.943115, creating an expectation that it may move to the resistance line at 0.9464. It may break through that line and continue the bullish trend or it may reverse from that line. Past performance is not an indicator of future results. Losses can exceed deposits.
Inminente recuperación o irrupción del EURCHF
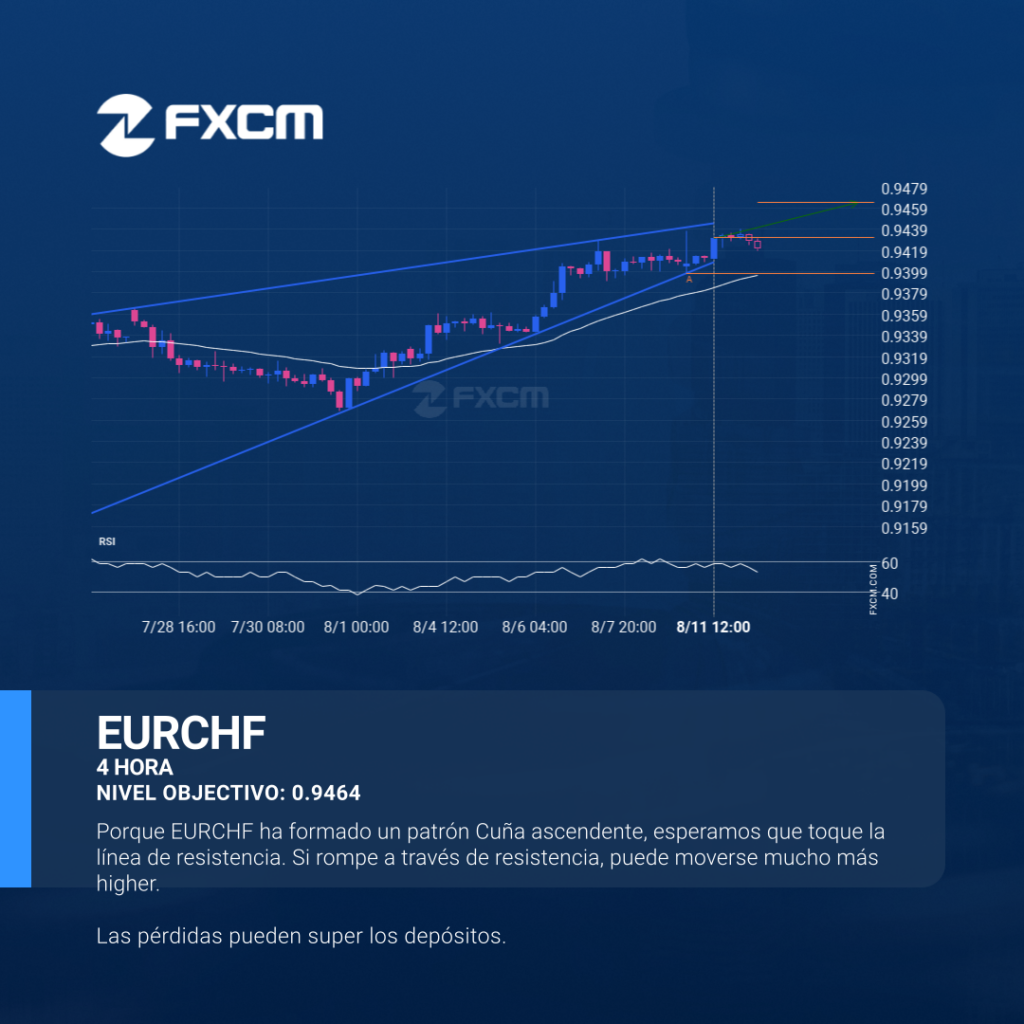
EURCHF está atrapado en una formación de Cuña ascendente, lo que implica que una rotura es inminente. Esta es una excelente configuración de trading tanto para los operadores de tendencia como para los de swing. Ahora se está acercando a una línea de soporte que se testeó en el pasado. Los oportunistas de la divergencia […]
¿Deberíamos esperar una ruptura o una recuperación del BTCUSD?
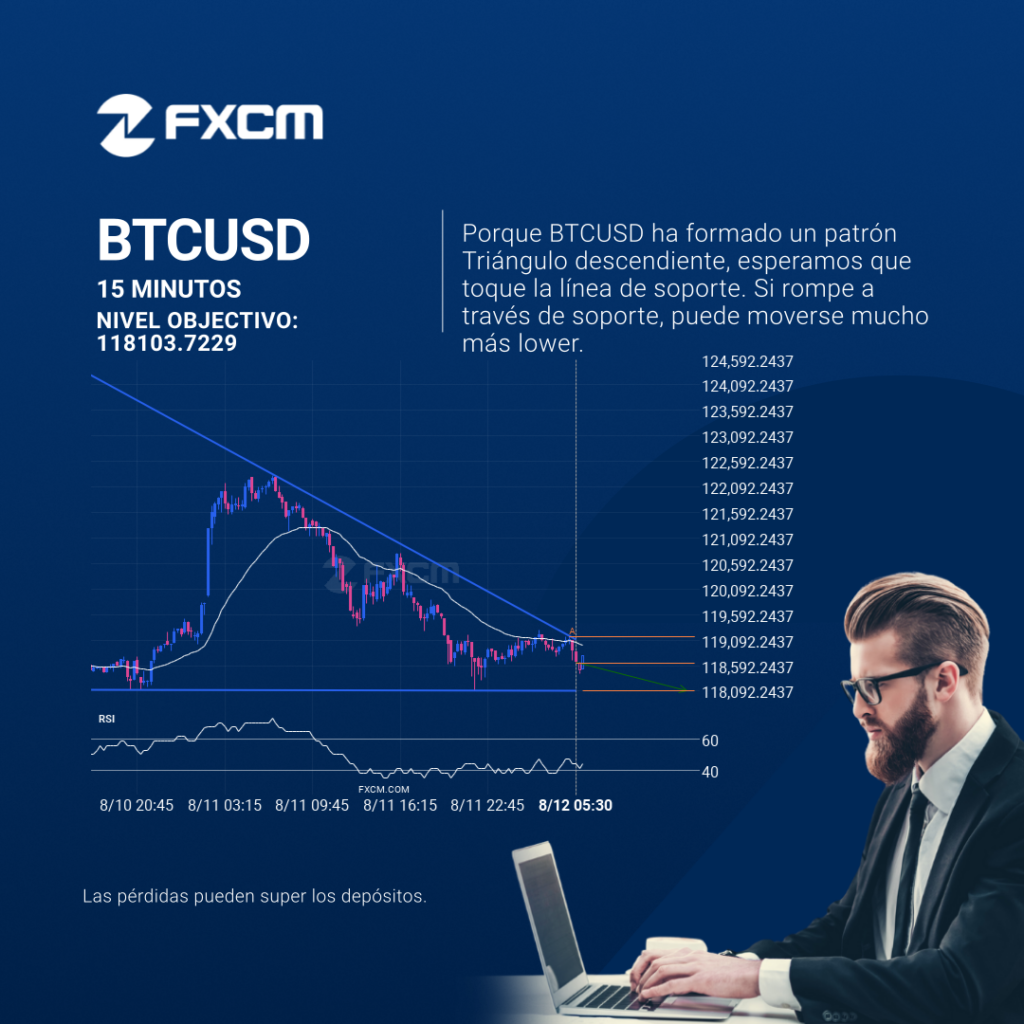
El BTCUSD avanza hacia la línea de soporte de un Triángulo descendiente, que ya ha probado varias veces en el pasado. Hemos visto un retroceso antes desde esta línea, así que en esta etapa no está claro si atravesará esta línea o se recuperará como lo ha hecho anteriormente. Si el BTCUSD continúa con esta […]
EURJPY – Continuation Chart Pattern – Channel Up
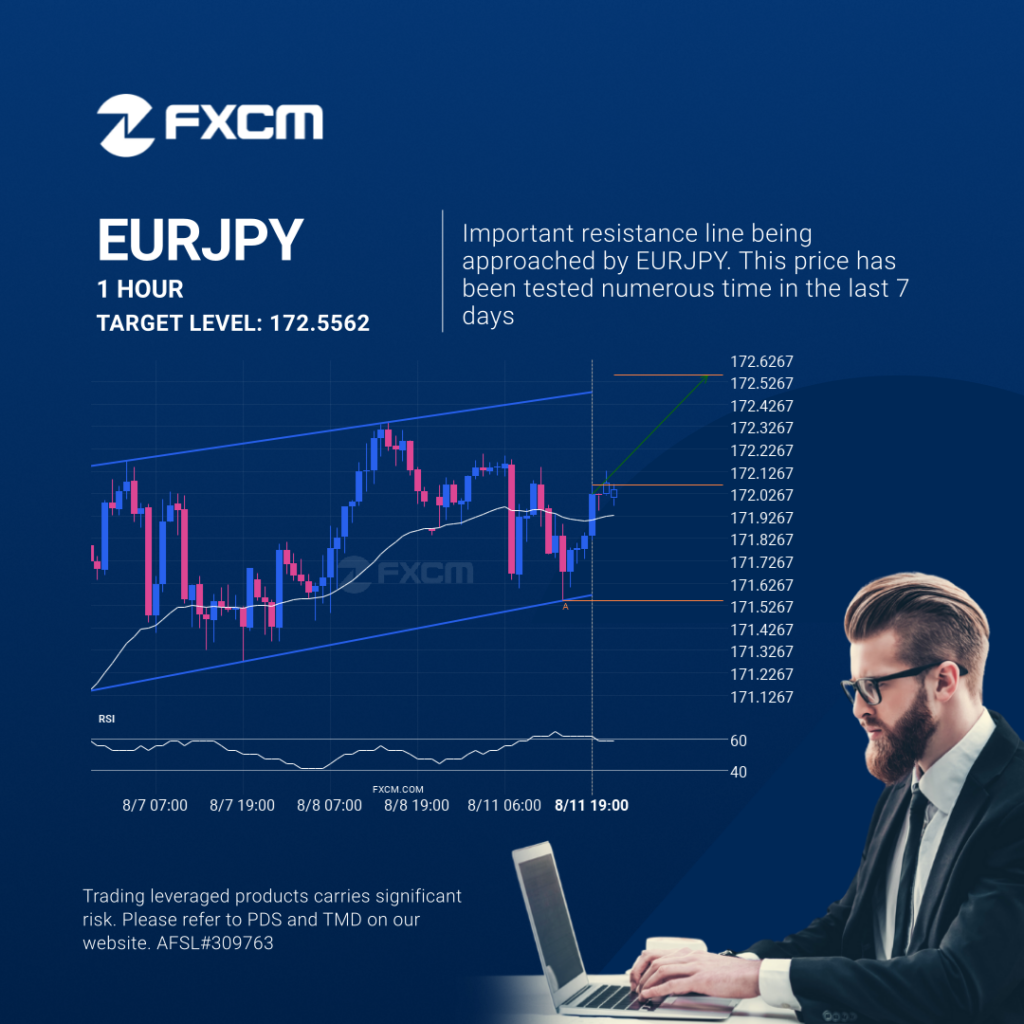
EURJPY is moving towards a resistance line. Because we have seen it retrace from this line before, we could see either a break through this line, or a rebound back to current levels. It has touched this line numerous times in the last 7 days and may test it again within the next 17 hours. […]
EURJPY – Continuation Patrón de gráfico – Canal alcista

El EURJPY avanza hacia una línea de resistencia. Como le hemos visto retroceder desde esta línea anteriormente, podríamos presenciar, o bien, una ruptura a través de esta línea o una recuperación a los niveles actuales. Ha llegado a esta línea en numerosas ocasiones en los últimos 7 días y puede probarla de nuevo en las […]
EURJPY – Continuation Chart Pattern – Channel Up
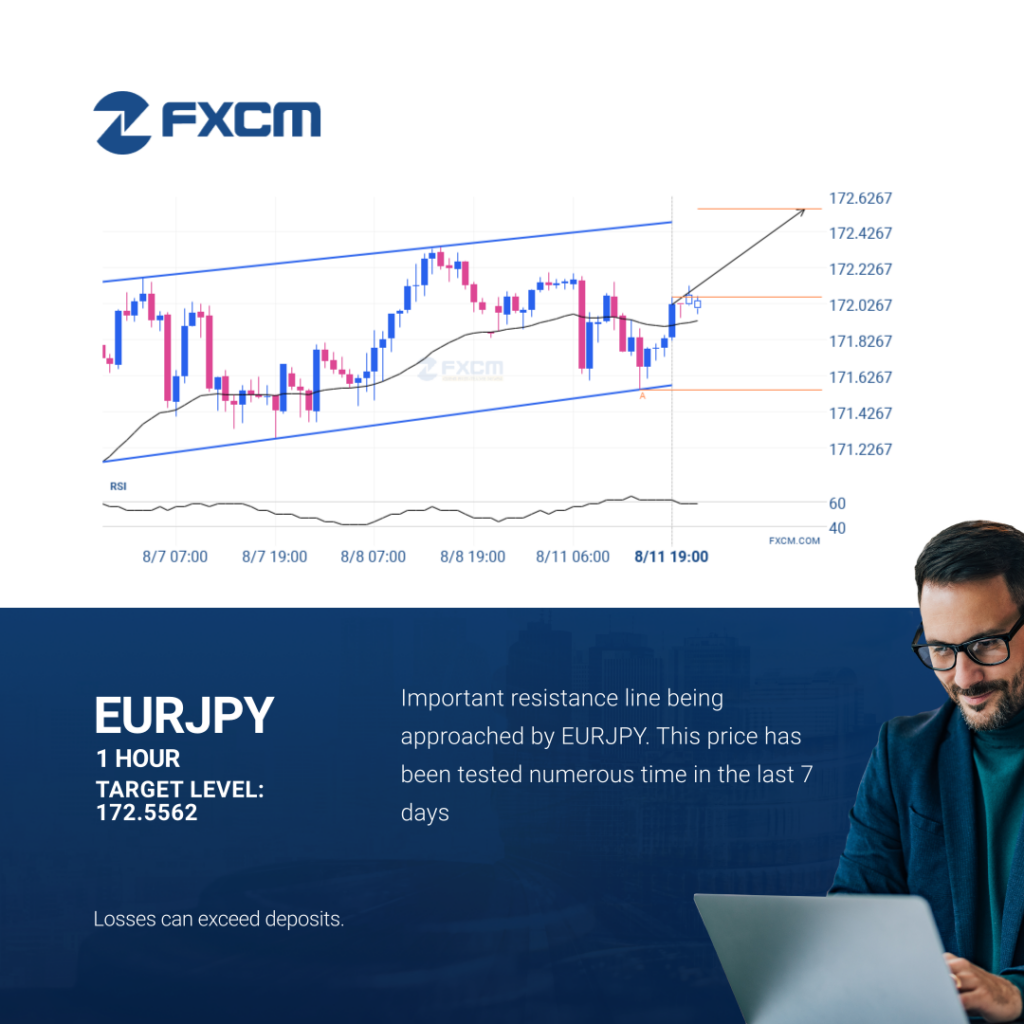
EURJPY is moving towards a resistance line. Because we have seen it retrace from this line before, we could see either a break through this line, or a rebound back to current levels. It has touched this line numerous times in the last 7 days and may test it again within the next 17 hours. […]
Se espera la posibilidad de un gran movimiento en el AUDUSD
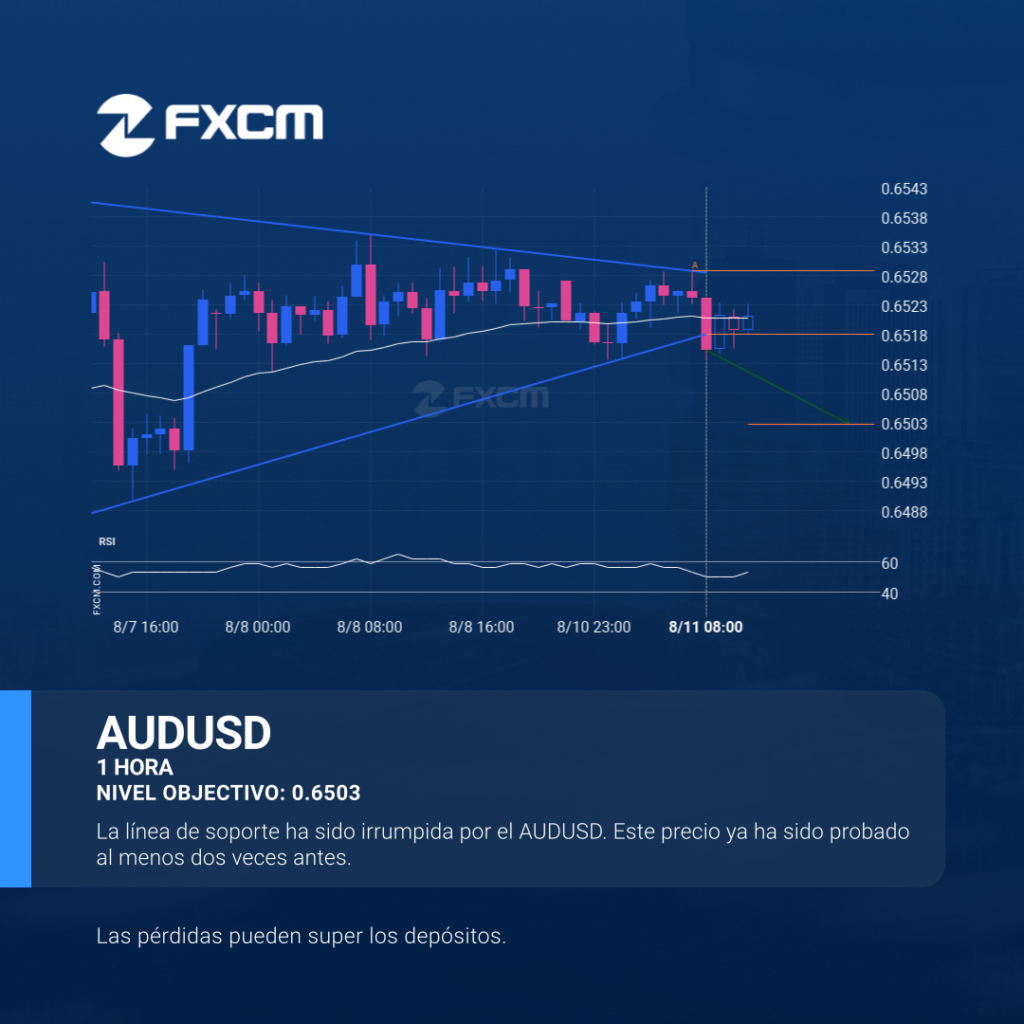
El AUDUSD ha atravesado una línea de soporte de un Triángulo y sugiere un movimiento posible a 0.6503 dentro de las próximas 10 horas. Ya ha probado esta línea en el pasado, por lo que deberíamos esperar la confirmación de esta irrupción antes de entrar en acción. Si dicha ruptura no se confirma, podríamos presenciar […]
Possibility of big movement expected on AUDUSD
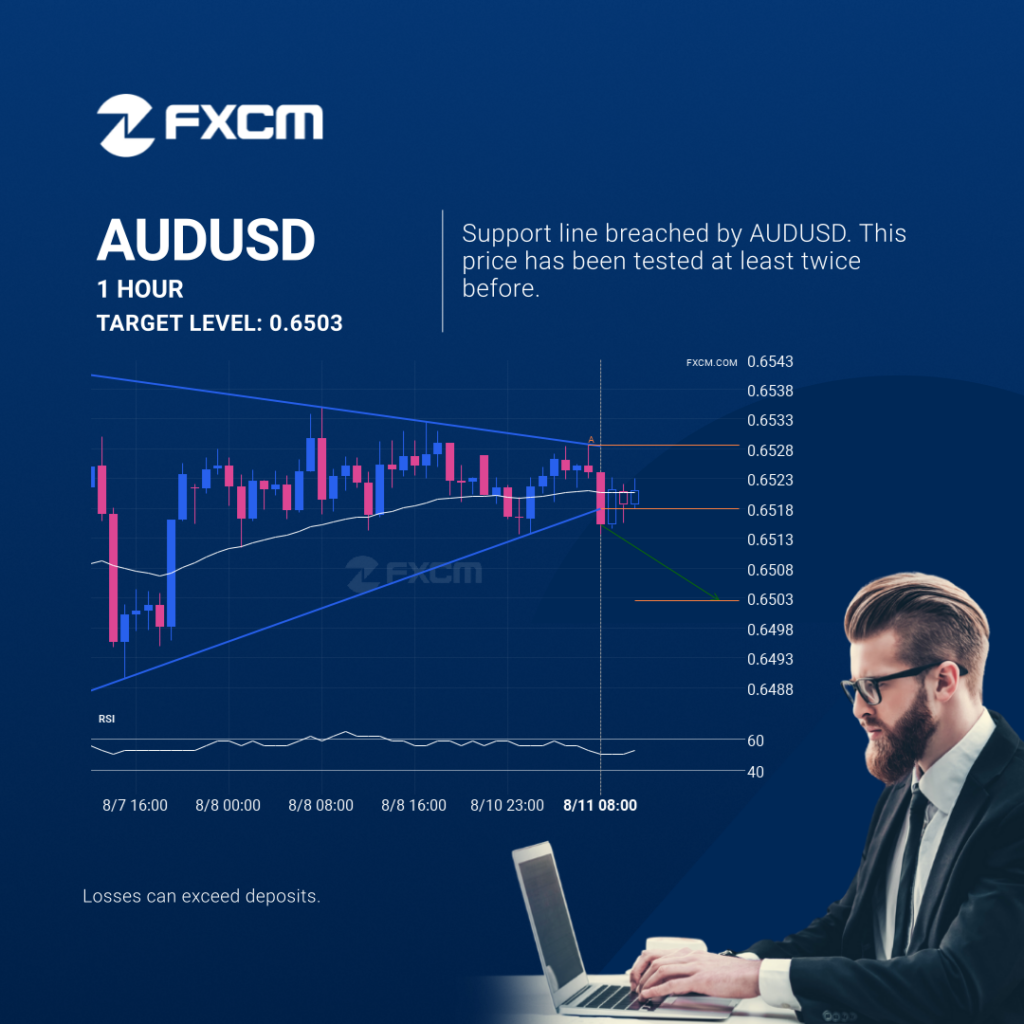
AUDUSD has broken through a support line of a Triangle and suggests a possible movement to 0.6503 within the next 10 hours. It has tested this line in the past, so one should probably wait for a confirmation of this breakout before taking action. If the breakout doesn’t confirm, we could see a retracement back […]