Un posible movimiento alcista en HKG33

El HKG33 se dirige a la línea de resistencia de un Canal alcista. Si este movimiento se mantiene, el precio de HKG33 podría probar el nivel de 26688.5775 en las próximas 3 días. Ya ha probado esta línea en numerosas ocasiones, por lo que este movimiento podría durar poco y terminar recuperándose, igual que ha […]
A possible start of a bearish trend on EURJPY
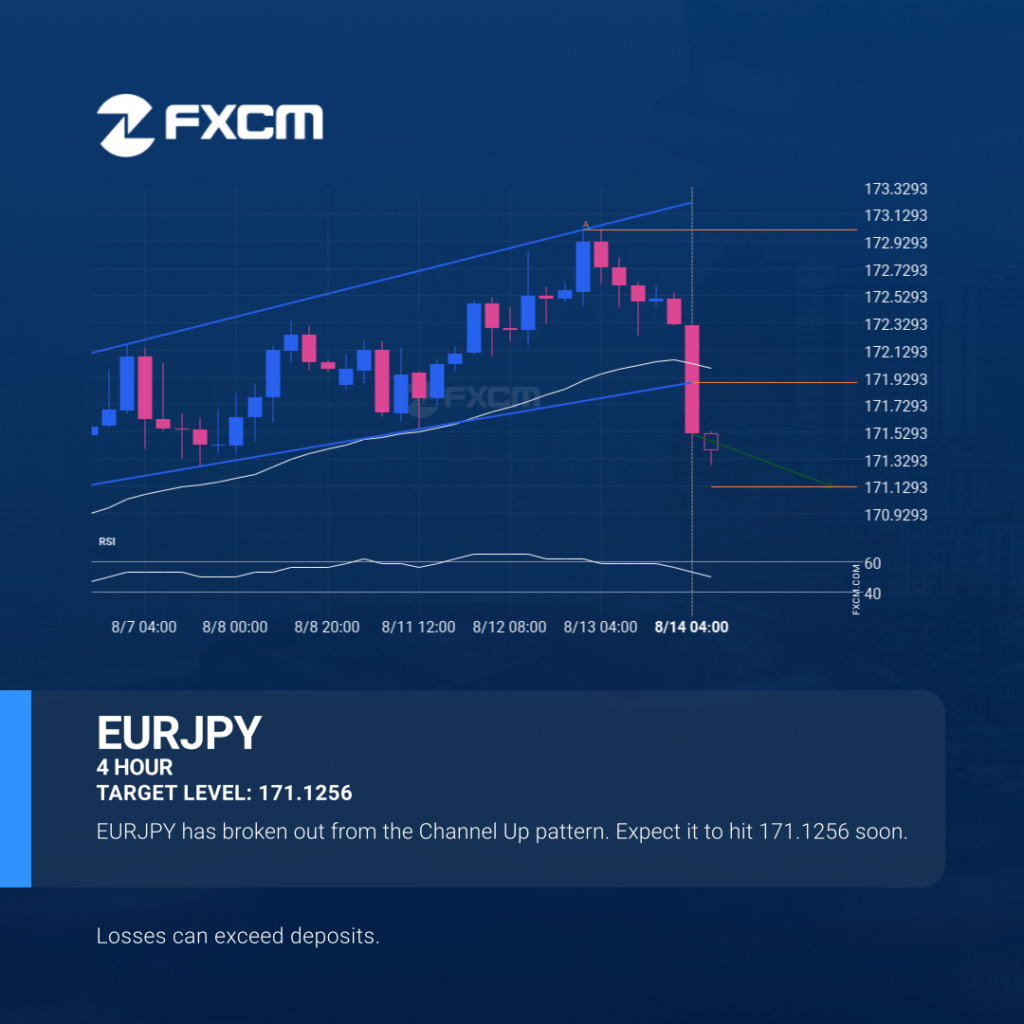
EURJPY moved through the support line of a Channel Up at 171.89174999999997 on the 4 hour chart. This line has been tested a number of times in the past and this breakout could mean an upcoming change from the current trend. It may continue in its current direction toward 171.1256. Past performance is not an […]
Un posible comienzo de una tendencia bajista en el EURJPY

EURJPY atravesó la línea de soporte de un patrón de Canal alcista en 171.89174999999997 en el gráfico de 4 Hora. Esta línea se ha testeado varias veces en el pasado y esta rotura podría significar un próximo cambio de la tendencia actual. Puede continuar en su dirección actual hacia 171.1256. El rendimiento pasado no es […]
Possible breach of support level by XAUUSD
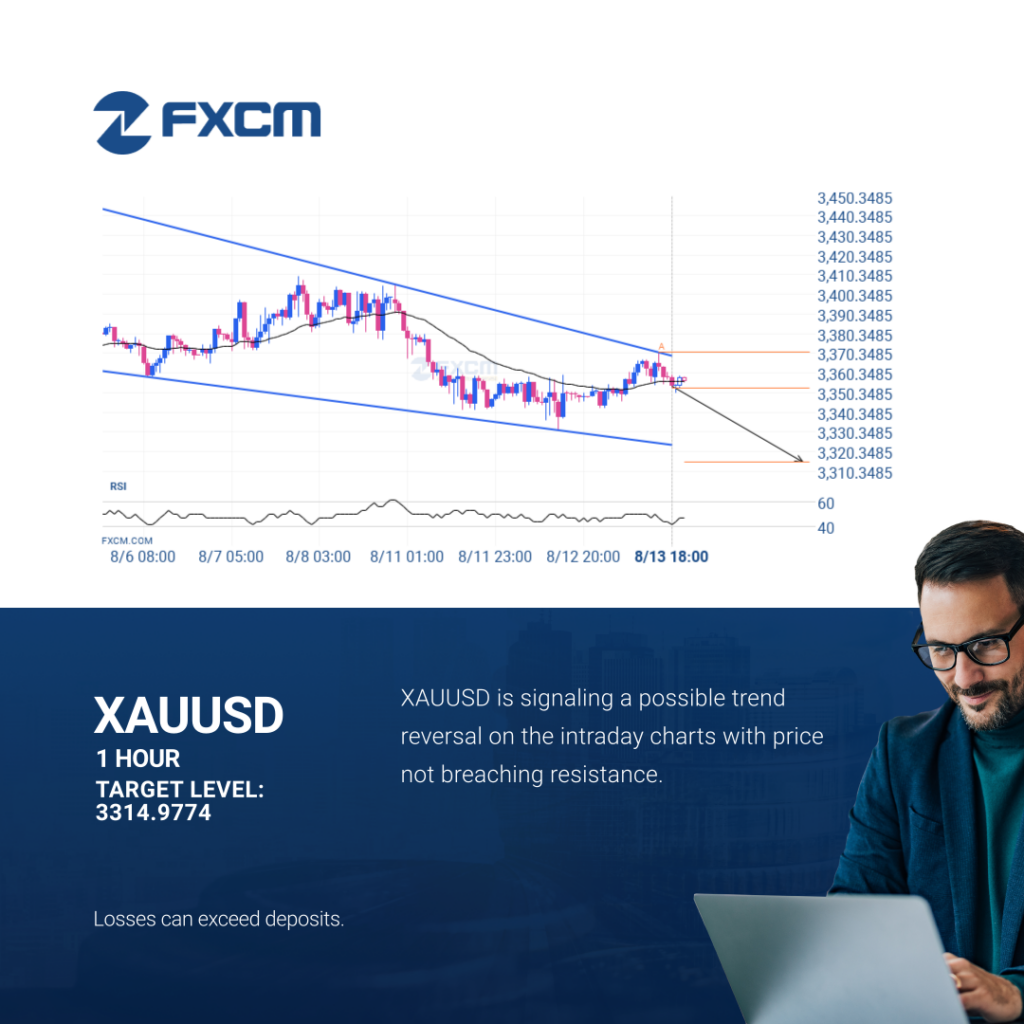
A Falling Wedge pattern was identified on XAUUSD at 3352.775, creating an expectation that it may move to the support line at 3314.9774. It may break through that line and continue the bearish trend or it may reverse from that line. Past performance is not an indicator of future results. Losses can exceed deposits.
Possible breach of support level by XAUUSD
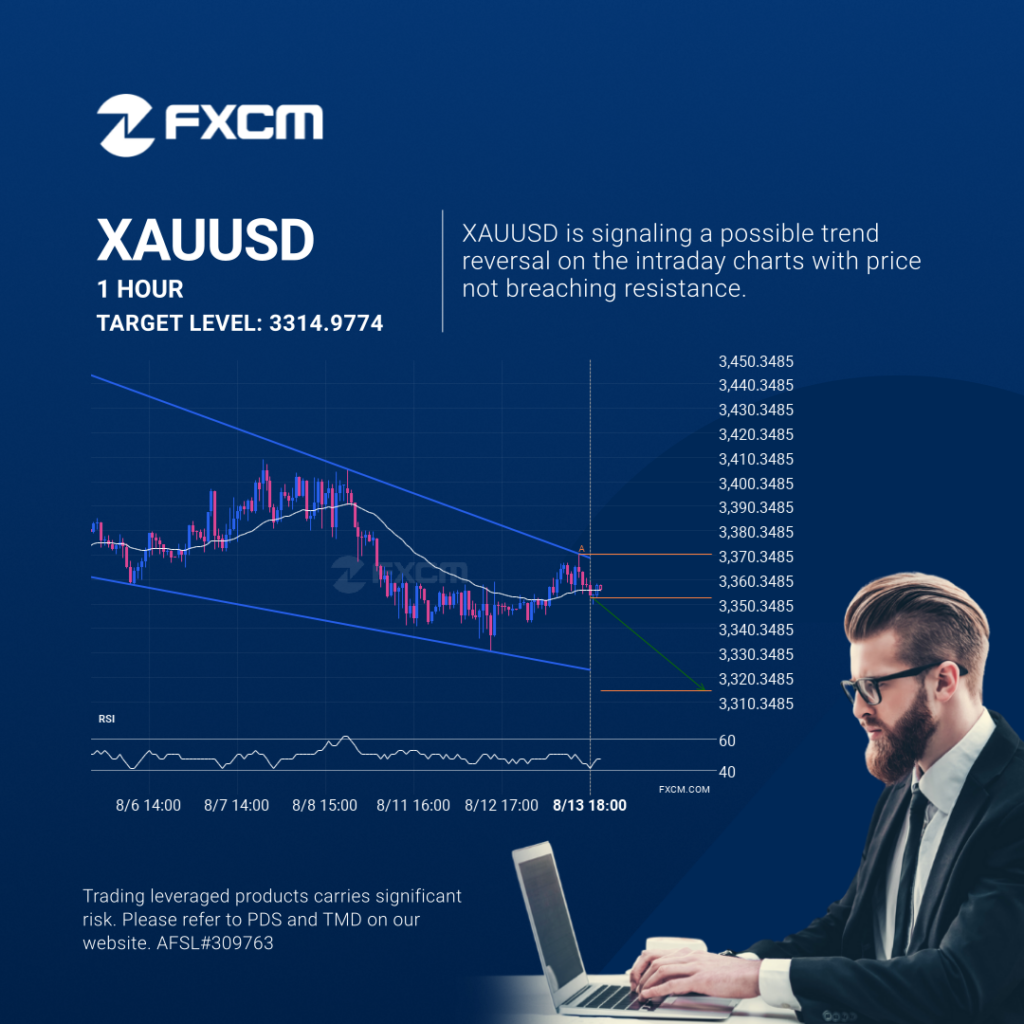
A Falling Wedge pattern was identified on XAUUSD at 3352.775, creating an expectation that it may move to the support line at 3314.9774. It may break through that line and continue the bearish trend or it may reverse from that line. Past performance is not an indicator of future results. Trading leveraged products carries significant […]
Posible ruptura del nivel de soporte en el XAUUSD
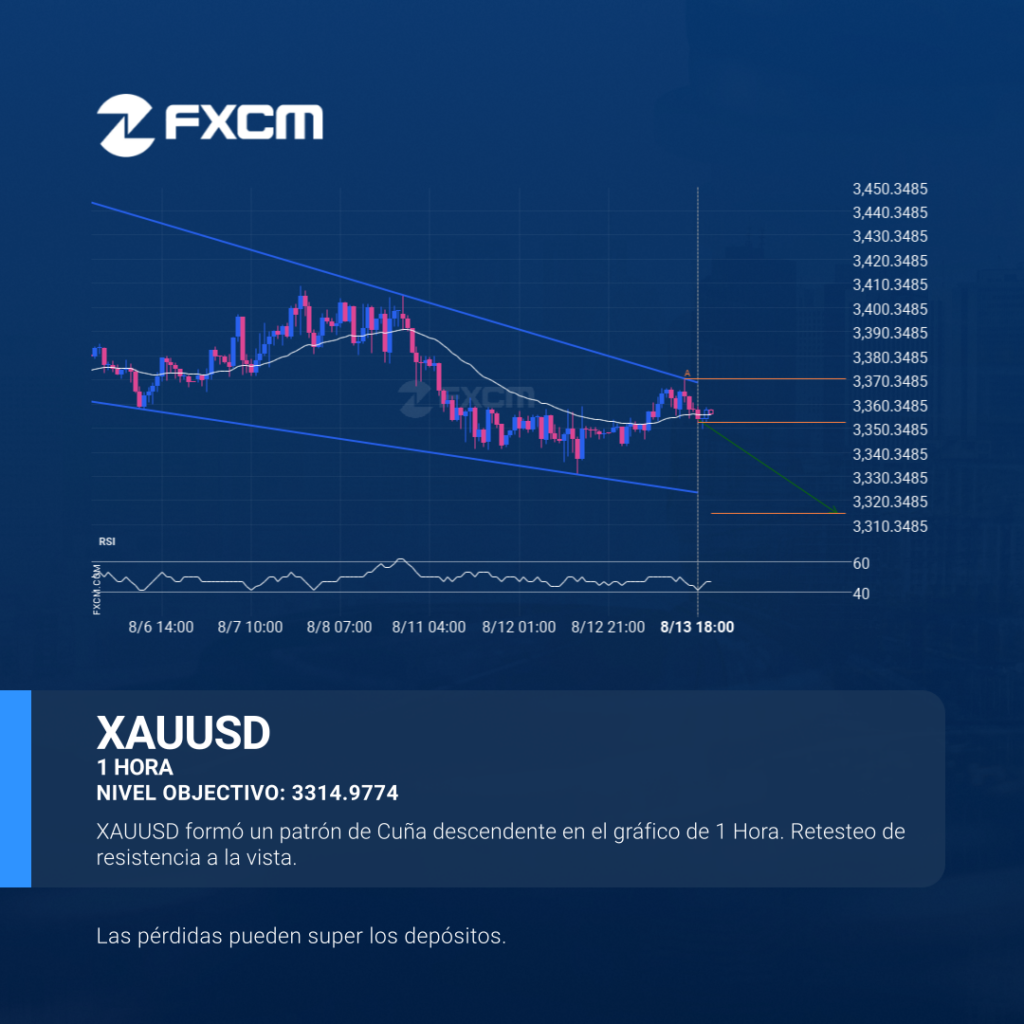
XAUUSD está atrapado en una formación de Cuña descendente, lo que implica que una rotura es inminente. Esta es una excelente configuración de trading tanto para los operadores de tendencia como para los de swing. Ahora se está acercando a una línea de resistencia que se testeó en el pasado. Los oportunistas de la divergencia […]
Un posible comienzo de una tendencia alcista en el BTCUSD
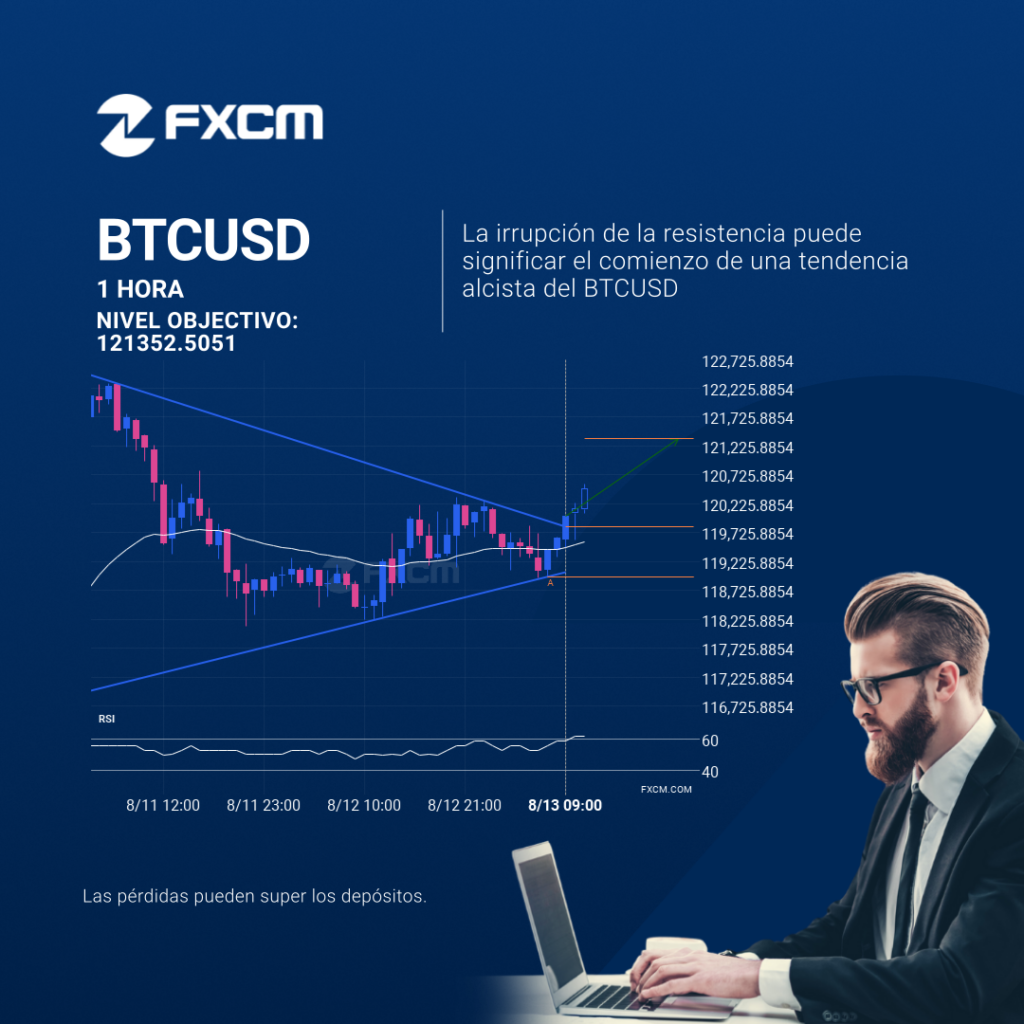
El BTCUSD ha atravesado una línea de resistencia de un patrón de gráfico que corresponde a un Triángulo. Si esta irrupción se mantiene, podríamos ver el precio del BTCUSD probando el nivel de 121352.5051 dentro de las próximas 13 horas. Pero no se apresure si desea operar, porque ya ha probado esta línea en el […]
AUDUSD – getting close to resistance of a Rising Wedge
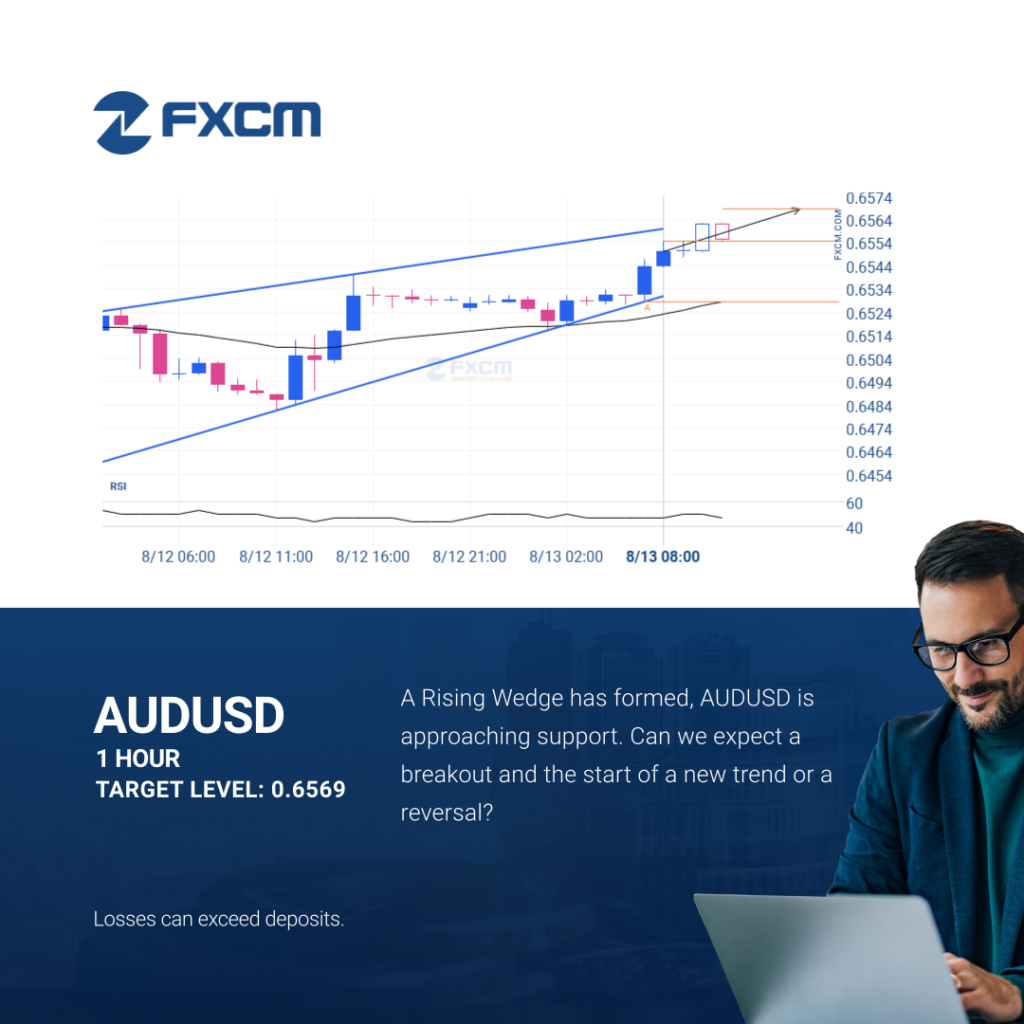
AUDUSD is moving towards a resistance line. Because we have seen it retrace from this line before, we could see either a break through this line, or a rebound back to current levels. It has touched this line numerous times in the last 2 days and may test it again within the next 5 hours. […]
AUDUSD – acercándose a la resistencia del Cuña ascendente

El AUDUSD avanza hacia una línea de resistencia. Como le hemos visto retroceder desde esta línea anteriormente, podríamos presenciar, o bien, una ruptura a través de esta línea o una recuperación a los niveles actuales. Ha llegado a esta línea en numerosas ocasiones en los últimos 2 días y puede probarla de nuevo en las […]
Either a rebound or a breakout imminent on EURJPY
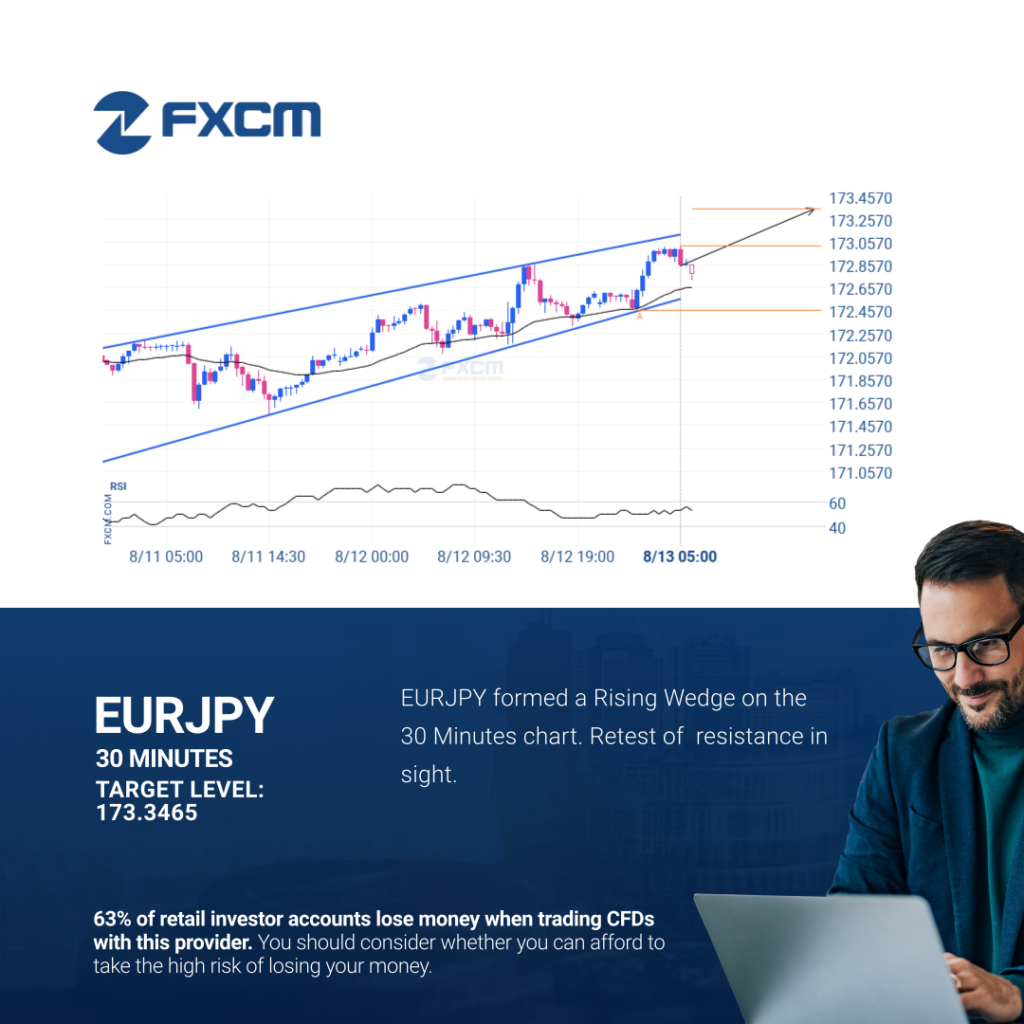
An emerging Rising Wedge has been detected on EURJPY on the 30 Minutes chart. There is a possible move towards 173.3465 next few candles. Once reaching support it may continue its bullish run or reverse back to current price levels. Past performance is not an indicator of future results. Trading leveraged products carries significant risk. […]