EURJPY approaching important bullish key level
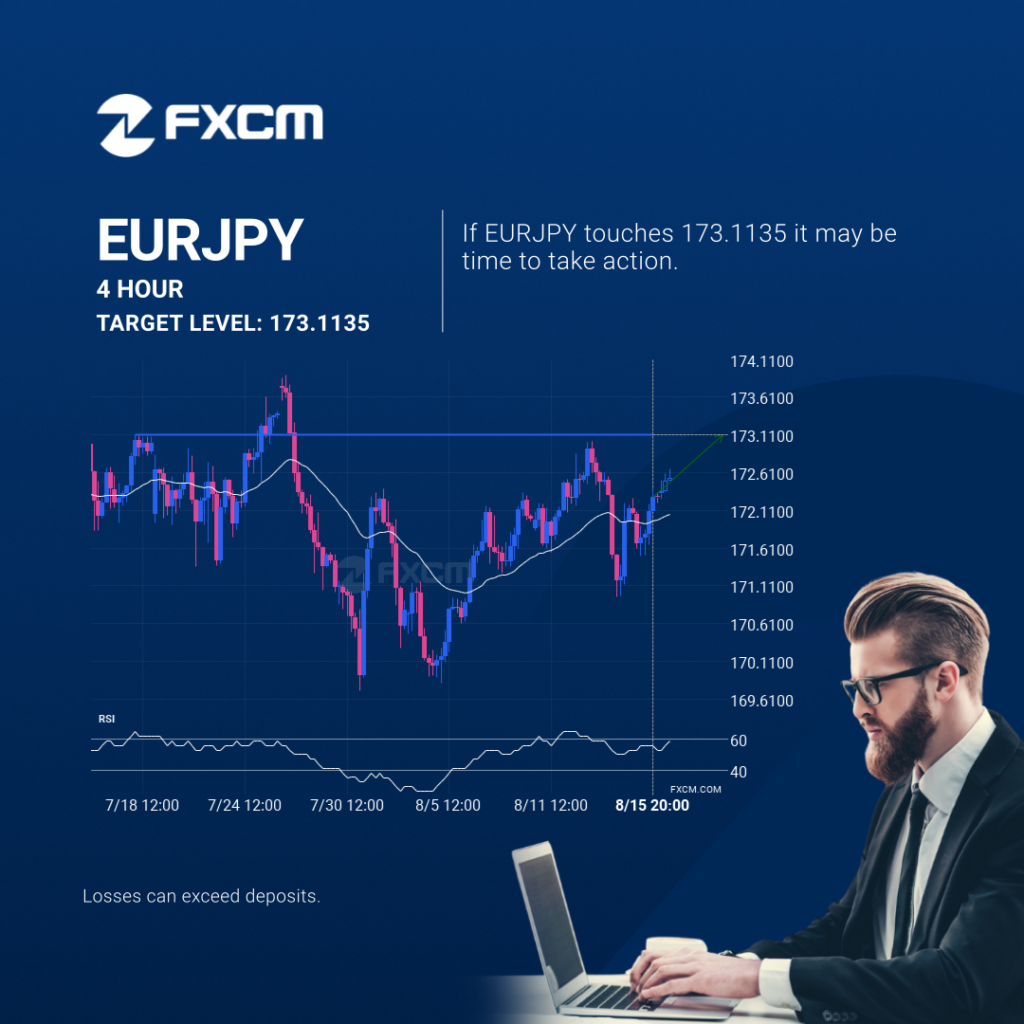
EURJPY is heading towards a line of 173.1135. If this movement continues, the price of EURJPY could test 173.1135 within the next 3 days. But don’t be so quick to trade, it has tested this line numerous times in the past, so this movement could be short-lived and end up rebounding. Past performance is not […]
EURJPY acercándose a un importante nivel alcista clave
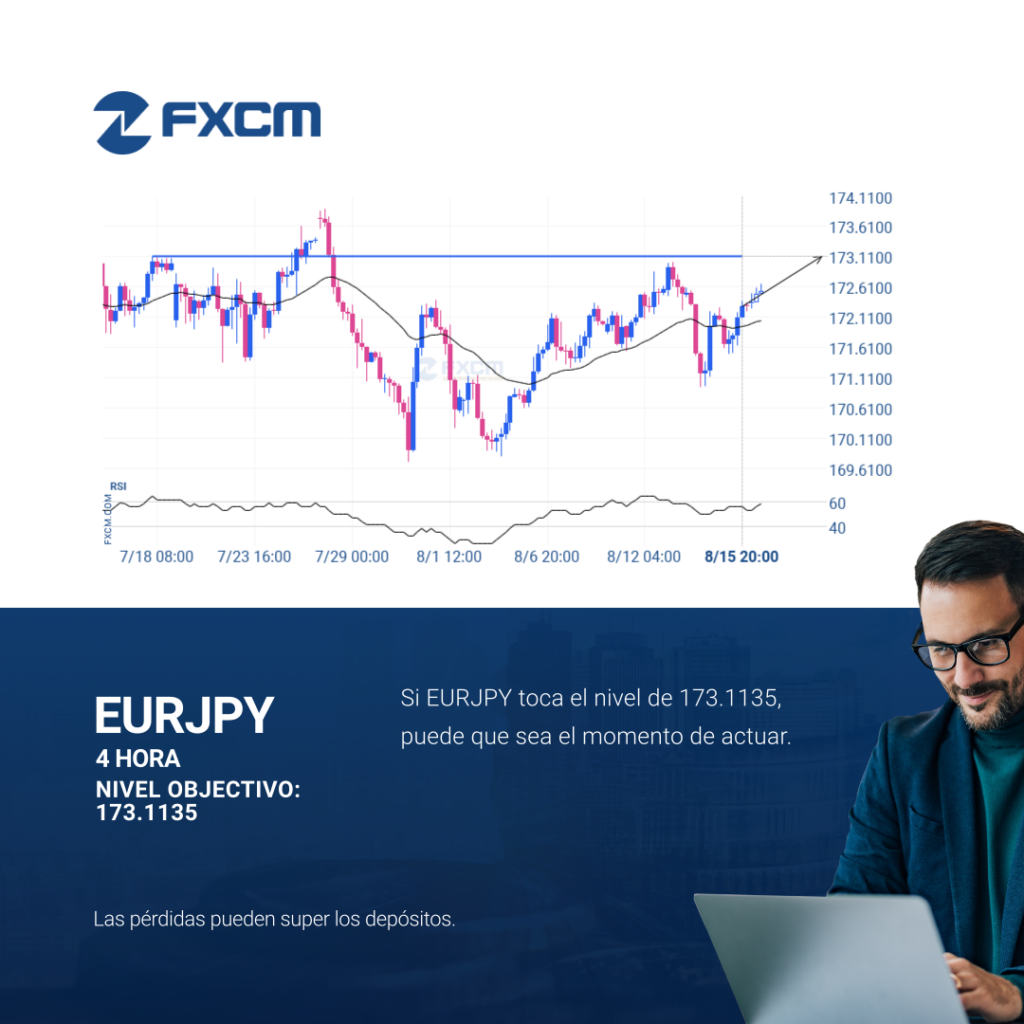
El EURJPY avanza hacia la línea de 173.1135. Si este movimiento se mantiene, el precio del EURJPY podría probar el nivel de 173.1135 en un plazo de 3 días. Pero no se apresure a la hora de operar, porque el par ha probado esta línea en numerosas ocasiones durante el pasado, por lo que este […]
¿Tendrá el AUDUSD suficiente impulso como para irrumpir el soporte?
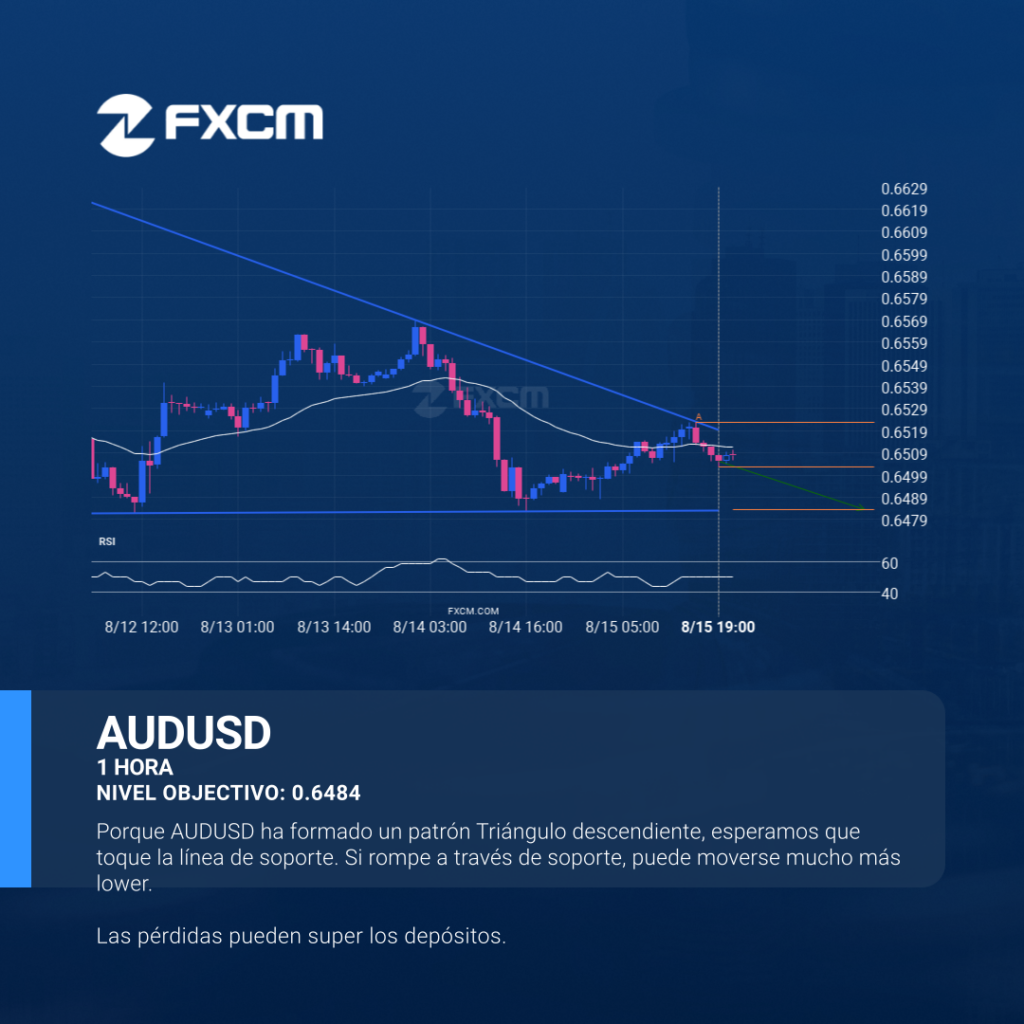
El AUDUSD se dirige a la línea de soporte de un Triángulo descendiente. Si este movimiento se mantiene, el precio de AUDUSD podría probar el nivel de 0.6484 en las próximas 23 horas. Ya ha probado esta línea en numerosas ocasiones, por lo que este movimiento podría durar poco y terminar recuperándose, igual que ha […]
A potential bearish movement on HKG33
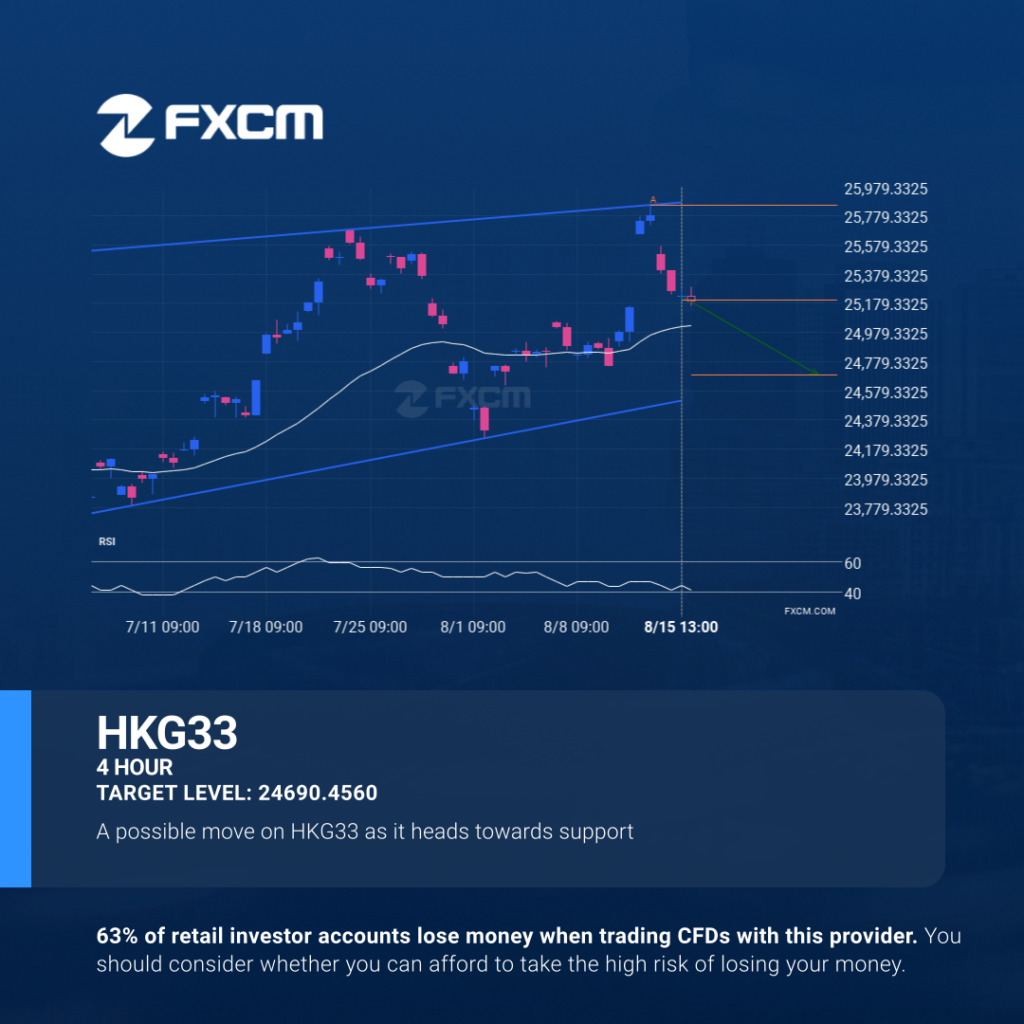
An emerging Rising Wedge has been detected on HKG33 on the 4 hour chart. There is a possible move towards 24690.4560 next few candles. Once reaching resistance it may continue its bearish run or reverse back to current price levels. Past performance is not an indicator of future results. Trading leveraged products carries significant risk. […]
BTCUSD – línea de precio psicológico atravesada
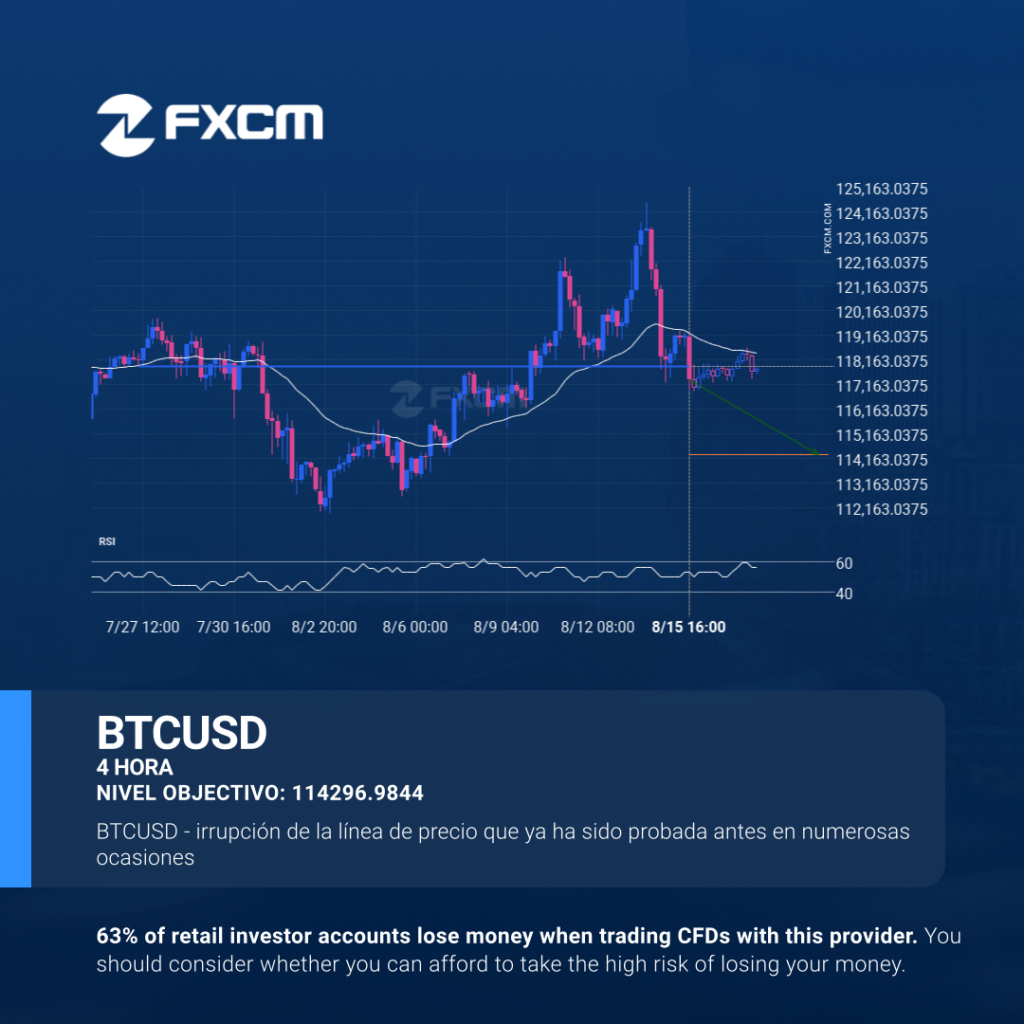
El BTCUSD ha atravesado la línea de 117866.3516, lo cual sugiere un posible movimiento en el nivel de 114296.9844 en las próximas 3 días. Ya ha probado esta línea en numerosas ocasiones durante el pasado, por lo que sería mejor esperar la confirmación de esta ruptura antes de llevar a cabo cualquier acción. Si no […]
Will AUDUSD have enough momentum to break support?
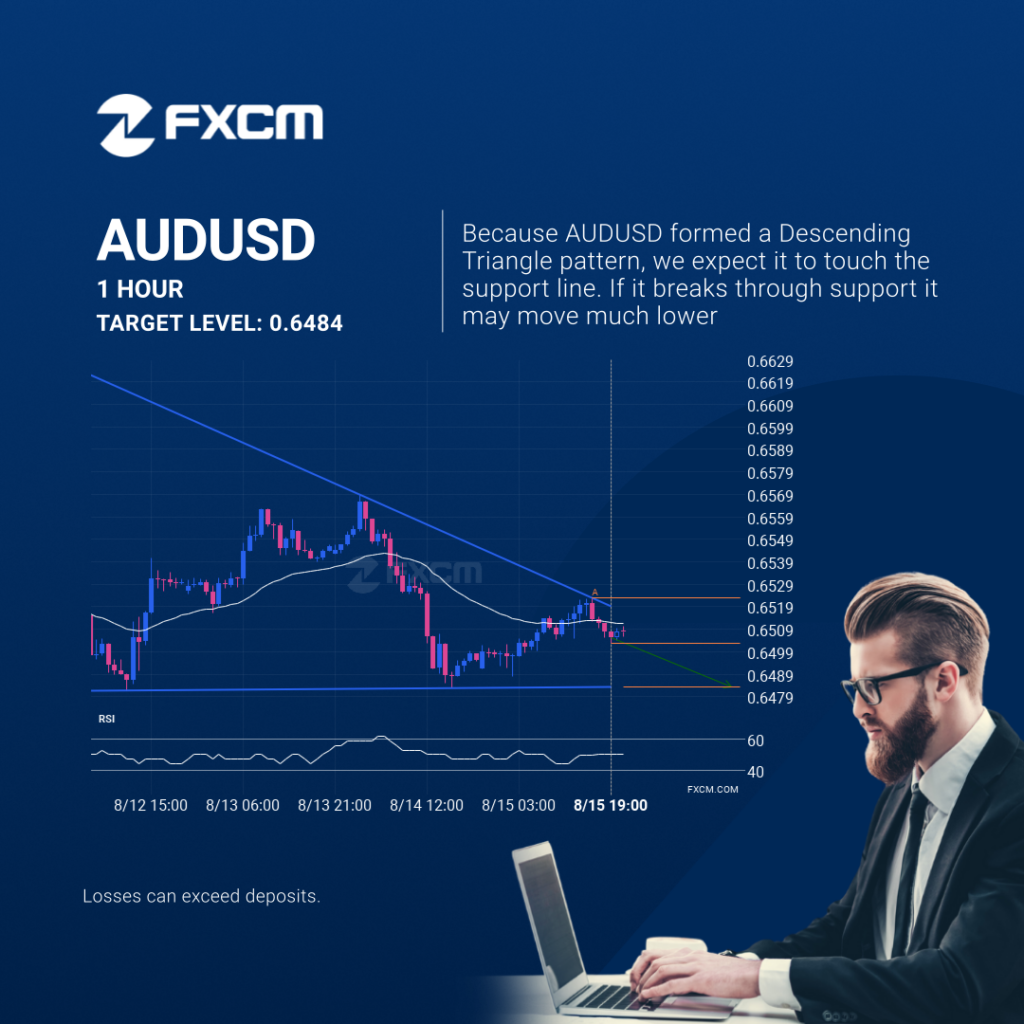
AUDUSD is heading towards the support line of a Descending Triangle. If this movement continues, the price of AUDUSD could test 0.6484 within the next 23 hours. It has tested this line numerous times in the past, so this movement could be short-lived and end up rebounding just like it did in the past. Past […]
Channel Up breakout on NZDUSD

NZDUSD has broken through the support line of a Channel Up technical chart pattern. Because we have seen it retrace from this line in the past, one should wait for confirmation of the breakout before taking any action. It has touched this line twice in the last 22 days and suggests a possible target level […]
Rotura de Canal alcista en NZDUSD
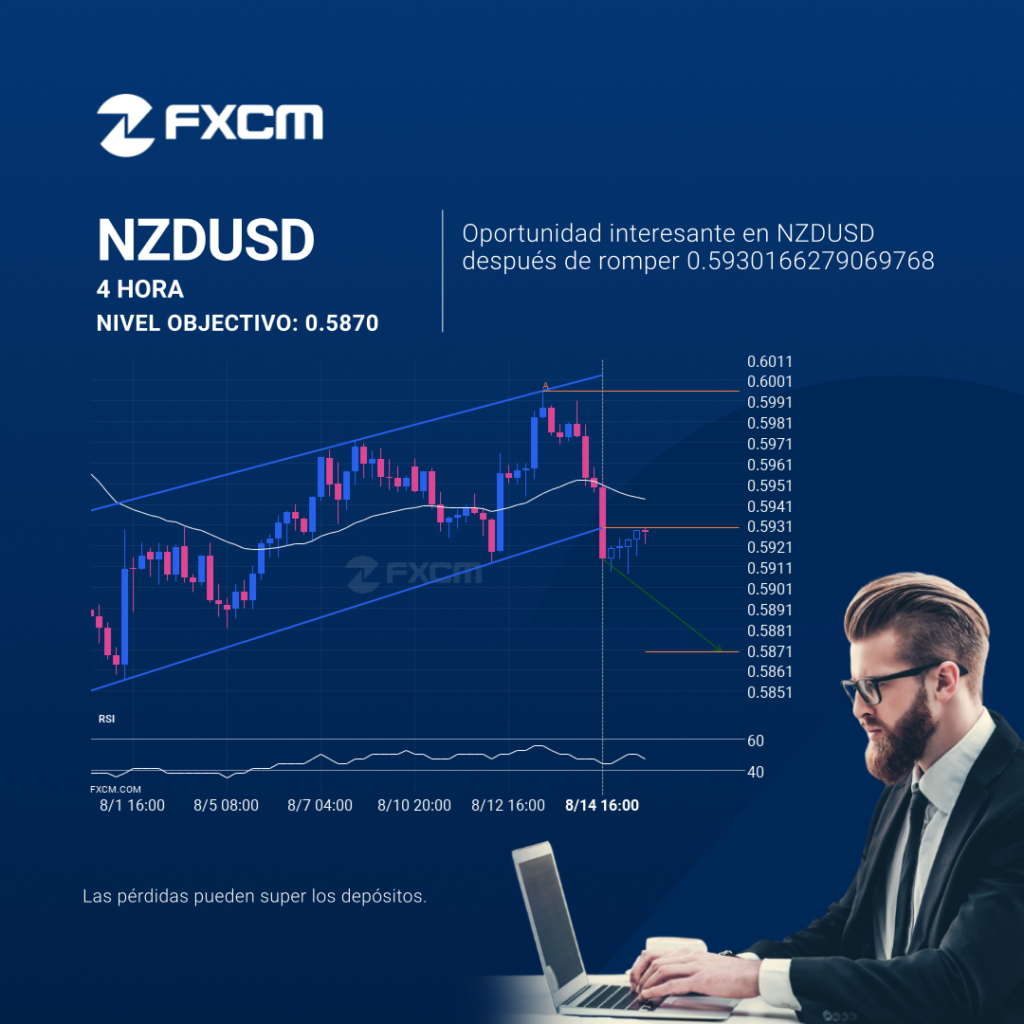
El NZDUSD ha atravesado la línea de soporte de un patrón de gráfico técnico con un Canal alcista. Como le hemos visto retroceder desde esta posición en el pasado, deberíamos esperar la confirmación de la ruptura antes de actuar. Ha llegado a esta línea dos veces en los últimos 22 días y sugiere un posible […]
Patrón Continuation en BTCUSD
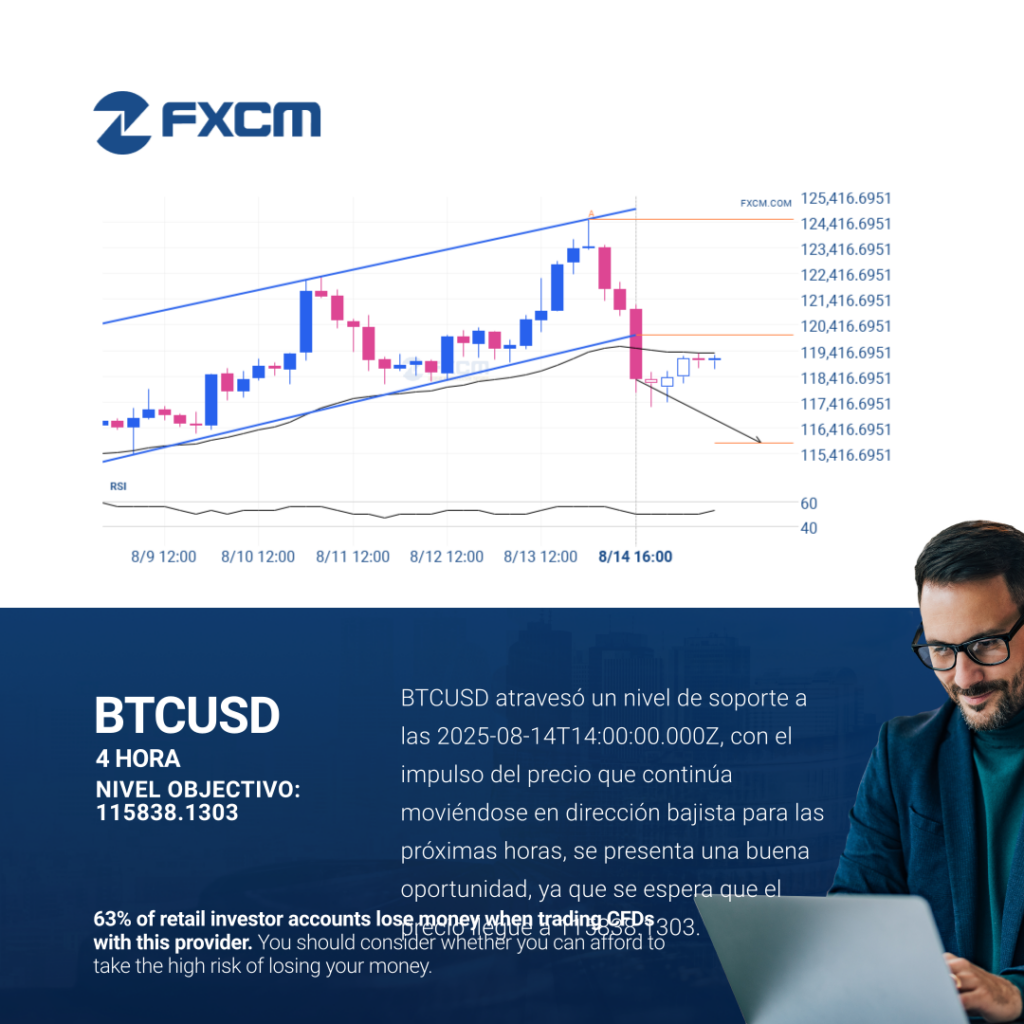
La irrupción del BTCUSD a través de la línea de soporte de un Canal alcista podría ser una señal de la ruta a seguir. Si esta irrupción persiste, podríamos ver el BTCUSD probando el nivel de 115838.1303 dentro de las próximas 20 horas. El rendimiento pasado no es indicativo de resultados futuros. Las pérdidas pueden […]
Resistance line breached by EURGBP
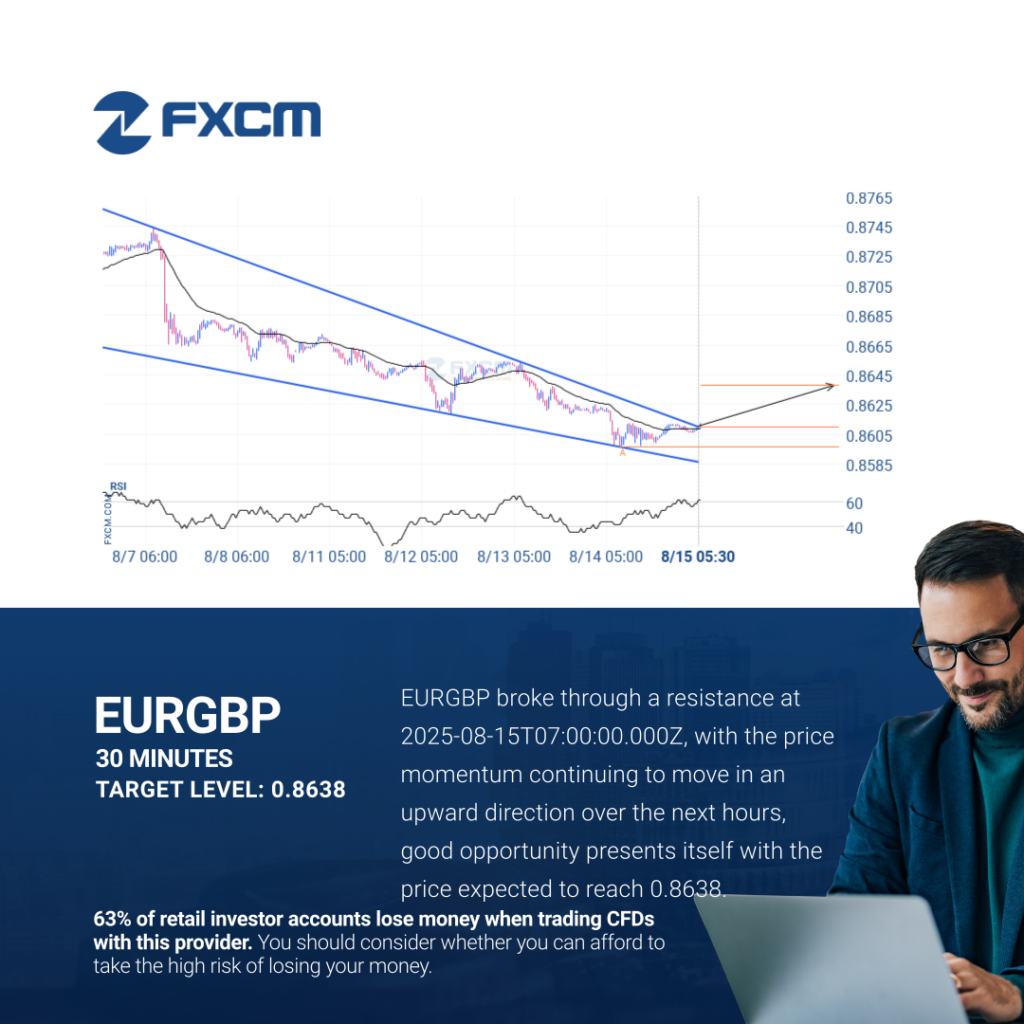
The breakout of EURGBP through the resistance line of a Falling Wedge could be a sign of the road ahead. If this breakout persists, we may see the price of EURGBP testing 0.8638 within the next 2 days. Past performance is not an indicator of future results. Trading leveraged products carries significant risk. Please refer […]