BTCUSD se acerca a un nivel importante en 118701.8828
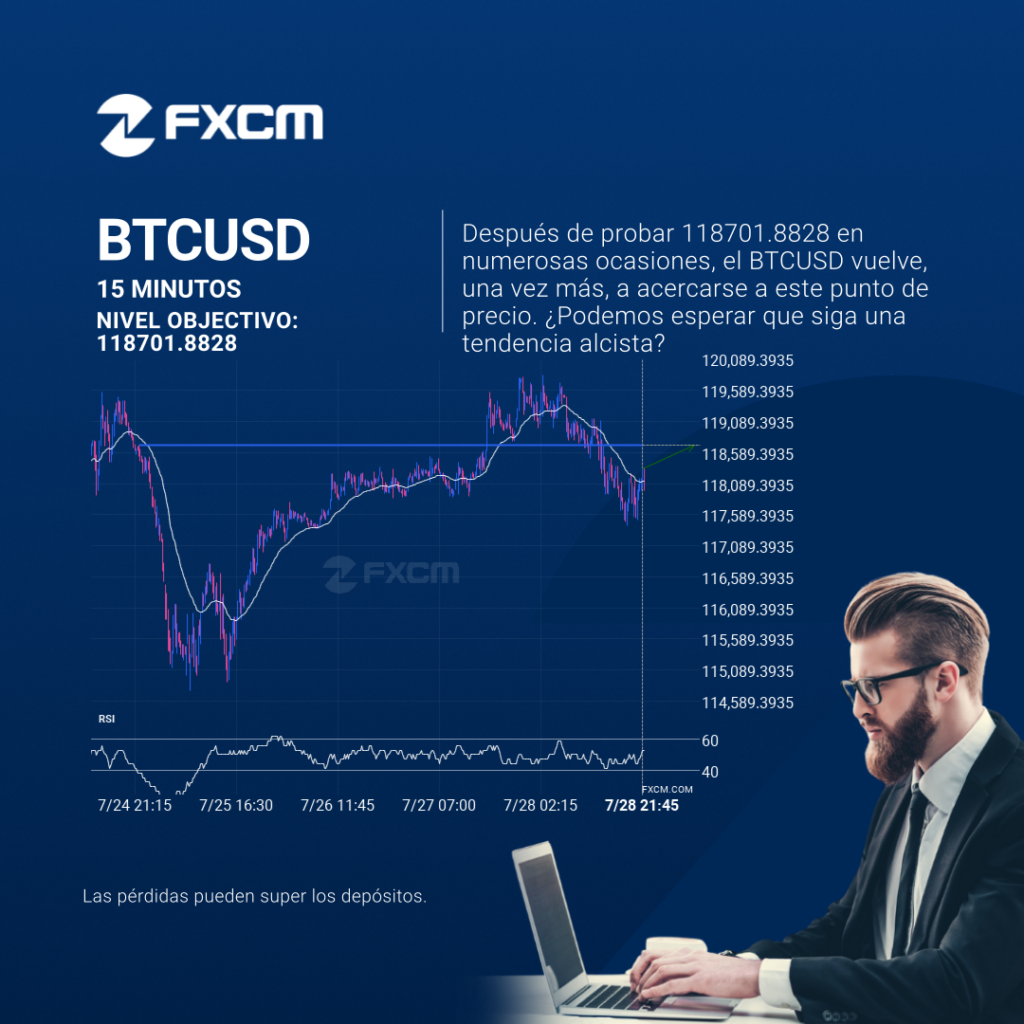
Se identificó un fuerte nivel de resistencia en 118701.8828 en el gráfico de 15 Minutos de BTCUSD. Es probable que BTCUSD lo testee pronto. El rendimiento pasado no es indicativo de resultados futuros. Las pérdidas pueden exceder los fondos depositados.
Patrón Continuation en ESP35
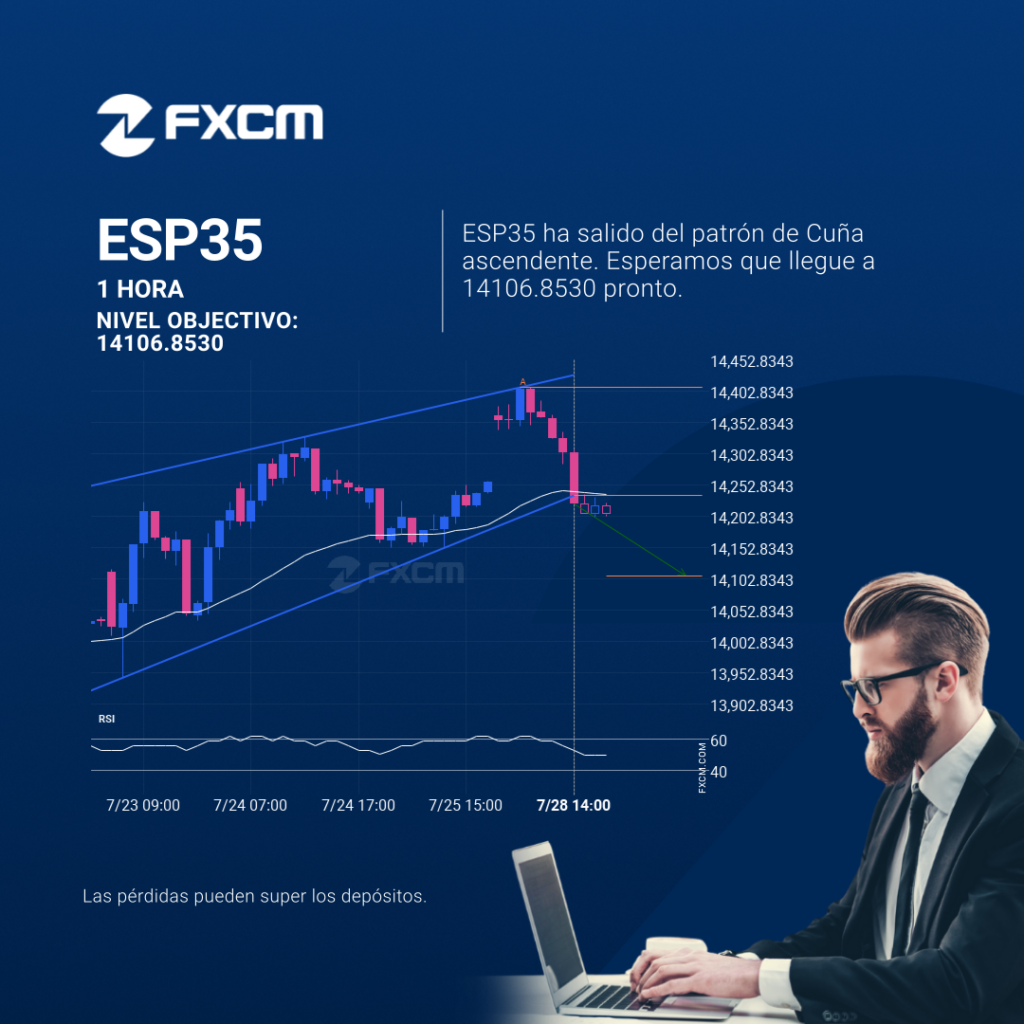
El ESP35 ha atravesado una línea de soporte de un patrón de gráfico que corresponde a un Cuña ascendente. Si esta irrupción se mantiene, podríamos ver el precio del ESP35 probando el nivel de 14106.8530 dentro de las próximas 9 horas. Pero no se apresure si desea operar, porque ya ha probado esta línea en […]
NZDUSD: línea de soporte rota a las 2025-07-28T06:00:00.000Z
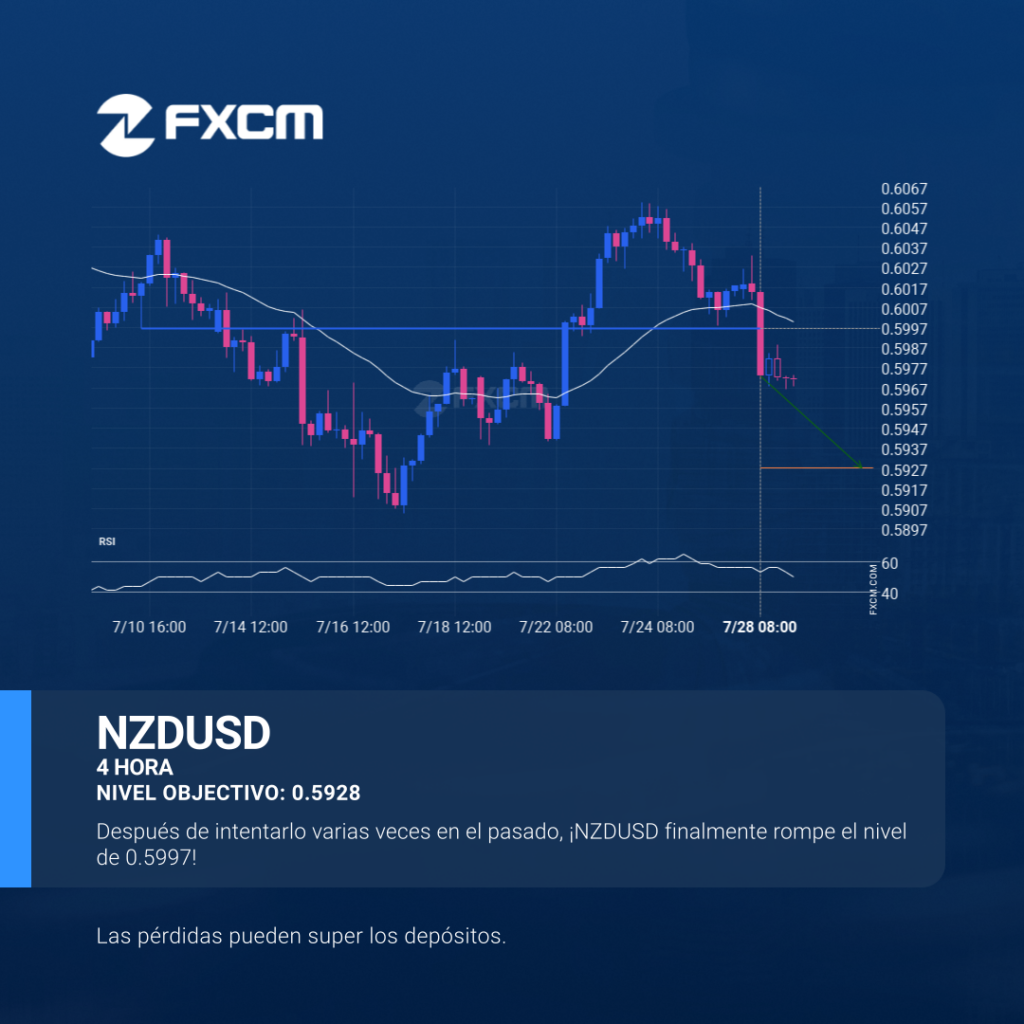
La rotura del NZDUSD a través de la línea de precio en 0.5997 es una brecha de un importante precio psicológico que se ha probado numerosas veces en el pasado. Si esta rotura persiste, el NZDUSD podría probar el nivel de 0.5928 durante las siguientes 3 días. Habría que ser prudentes antes de ejecutar una […]
Continuation pattern on ESP35
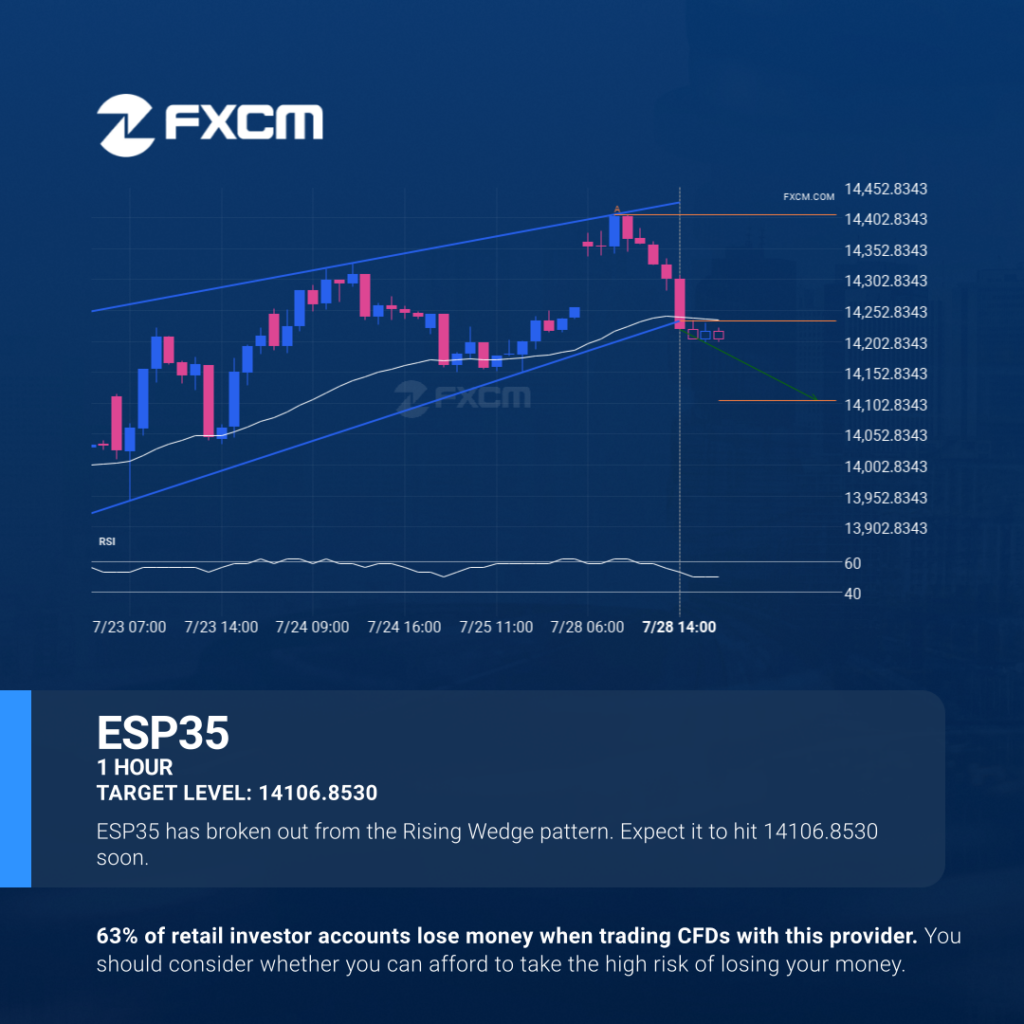
ESP35 has broken through a support line of a Rising Wedge chart pattern. If this breakout holds true, we may see the price of ESP35 testing 14106.8530 within the next 9 hours. But don’t be so quick to trade, it has tested this line in the past, so you should confirm the breakout before taking […]
NZDUSD – support line broken at 2025-07-28T06:00:00.000Z
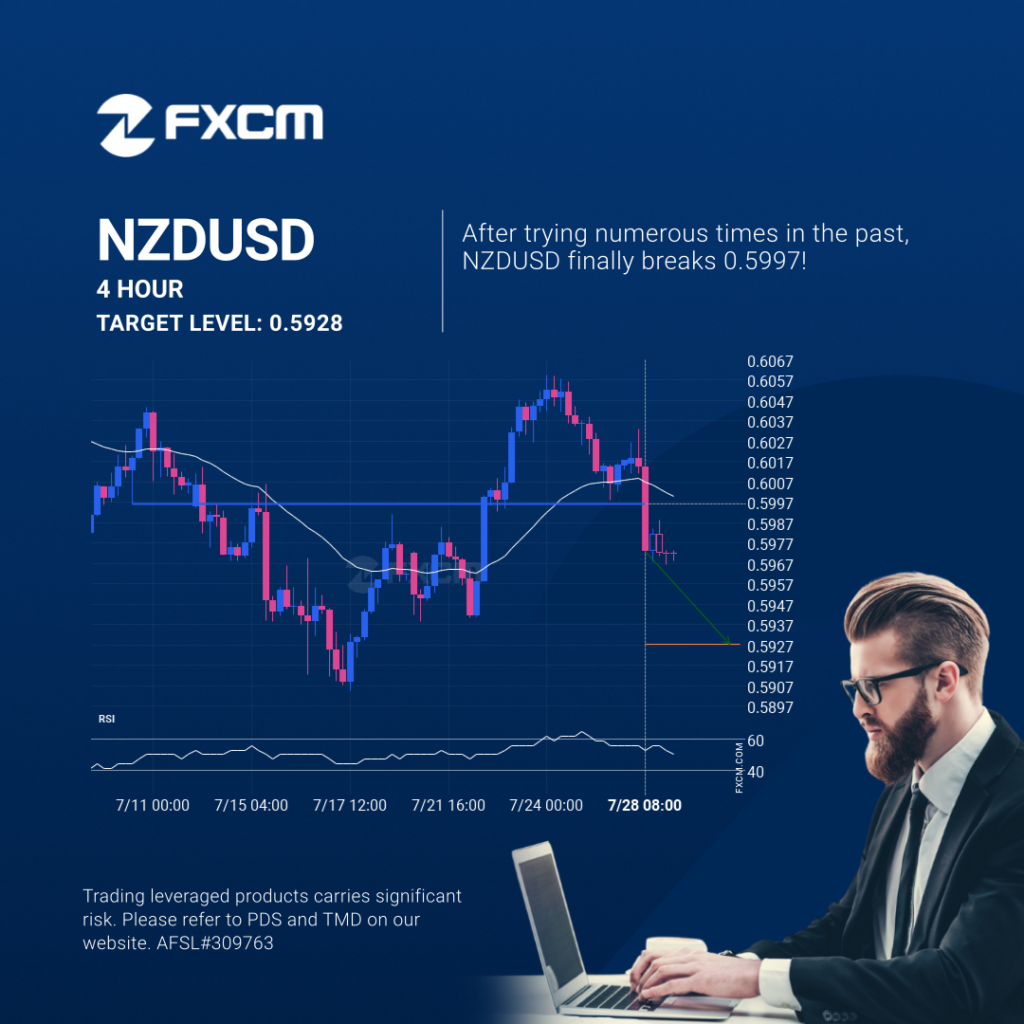
The breakout of NZDUSD through the 0.5997 price line is a breach of an important psychological price that is has tested numerous in the past. If this breakout persists, NZDUSD could test 0.5928 within the next 3 days. One should always be cautious before placing a trade, wait for confirmation of the breakout. Past performance […]
Continuation pattern on ESP35
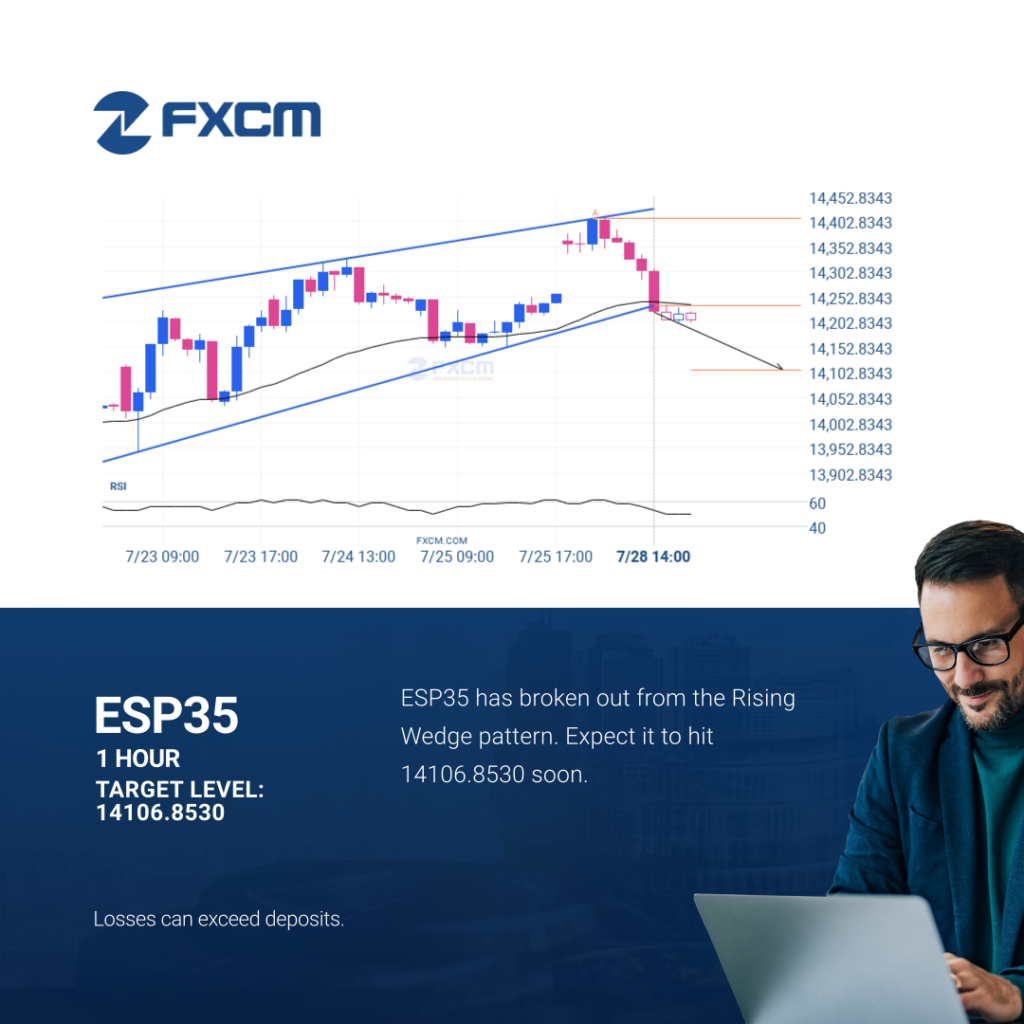
ESP35 has broken through a support line of a Rising Wedge chart pattern. If this breakout holds true, we may see the price of ESP35 testing 14106.8530 within the next 9 hours. But don’t be so quick to trade, it has tested this line in the past, so you should confirm the breakout before taking […]
EURGBP approaching important level of 0.8647
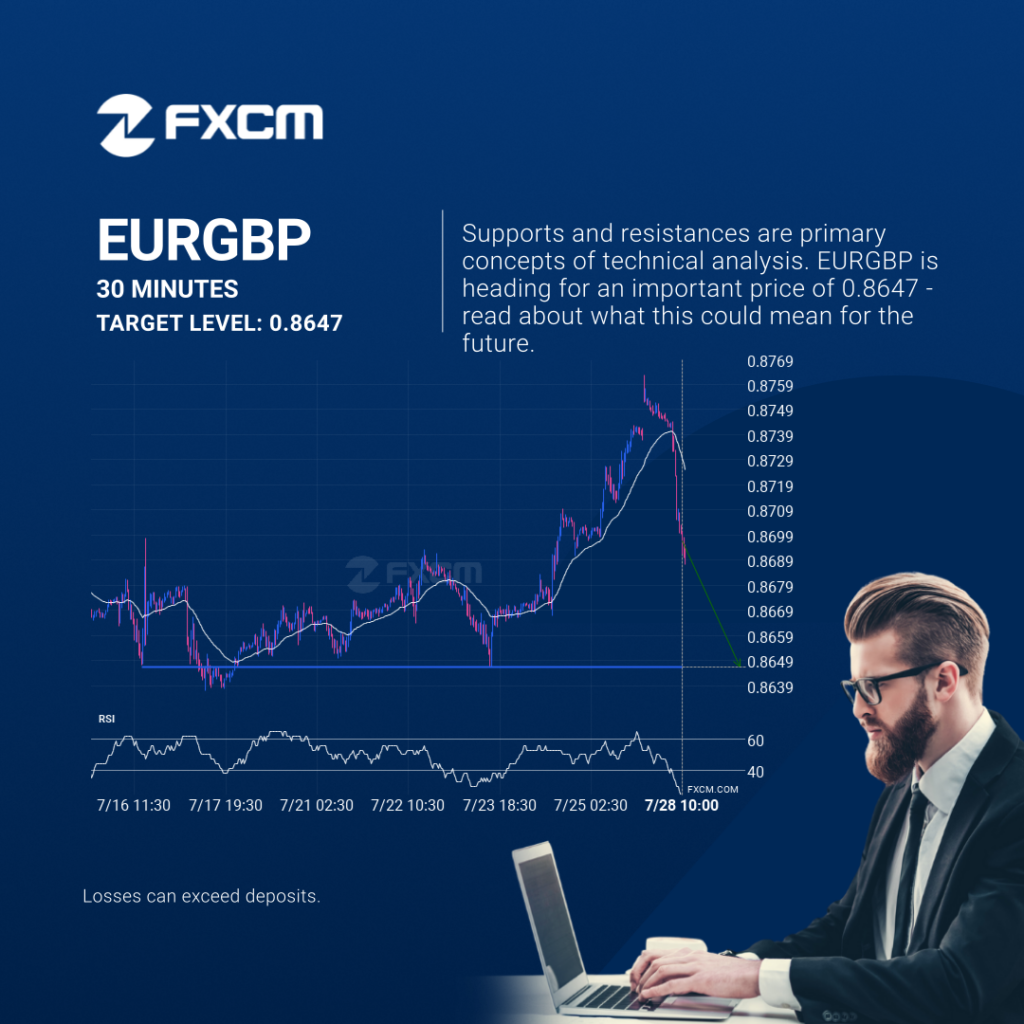
A strong support level has been identified at 0.8647 on the 30 Minutes EURGBP chart. EURGBP is likely to test it soon. Past performance is not an indicator of future results. Losses can exceed deposits.
EURGBP se acerca a un nivel importante en 0.8647
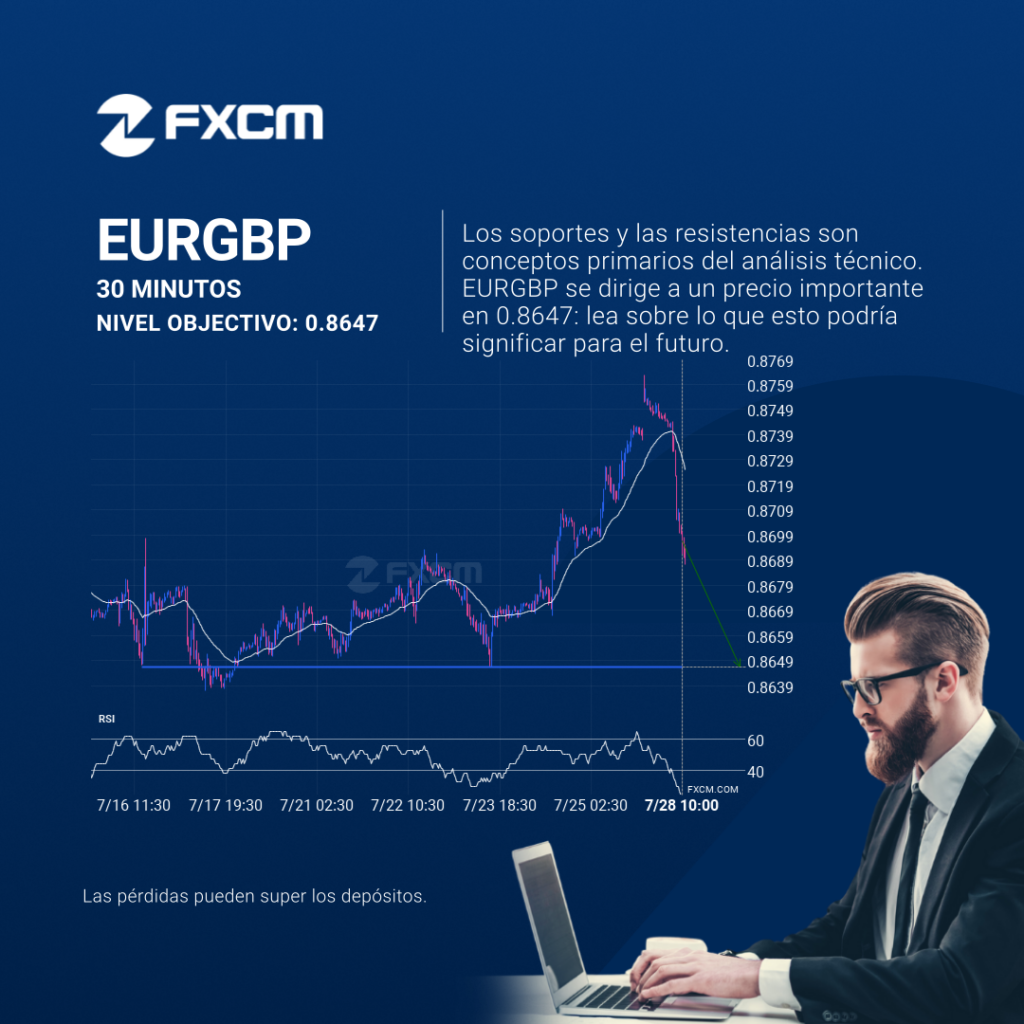
Se identificó un fuerte nivel de soporte en 0.8647 en el gráfico de 30 Minutos de EURGBP. Es probable que EURGBP lo testee pronto. El rendimiento pasado no es indicativo de resultados futuros. Las pérdidas pueden exceder los fondos depositados.
A potential bullish movement on EURCHF
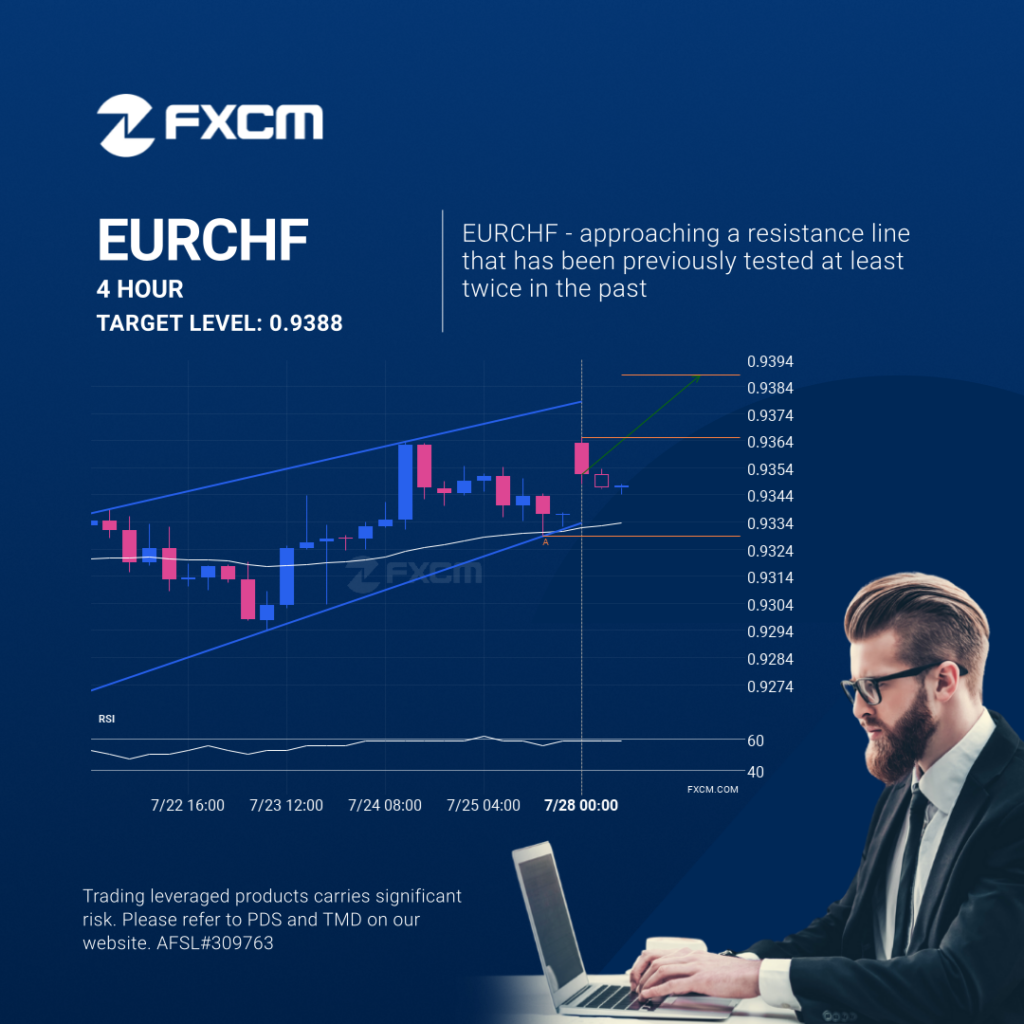
EURCHF was identified at around 0.936485 having recently rebounded of the support on the 4 hour data interval. Ultimately, the price action of the stock has formed a Rising Wedge pattern. This squeeze may increases the chances of a strong breakout. The projected movement will potentially take the price to around the 0.9388 level. Past […]
EURCHF – Patrón de gráfico Continuation – Cuña ascendente

Se identificó un patrón de Cuña ascendente en EURCHF en 0.936485, lo que generó la expectativa de que podría moverse a la línea de resistencia en 0.9388. Puede atravesar esa línea y continuar la tendencia alcista o puede girarse desde esa línea. El rendimiento pasado no es indicativo de resultados futuros. Las pérdidas pueden exceder […]