Possible breach of support level by AUDUSD
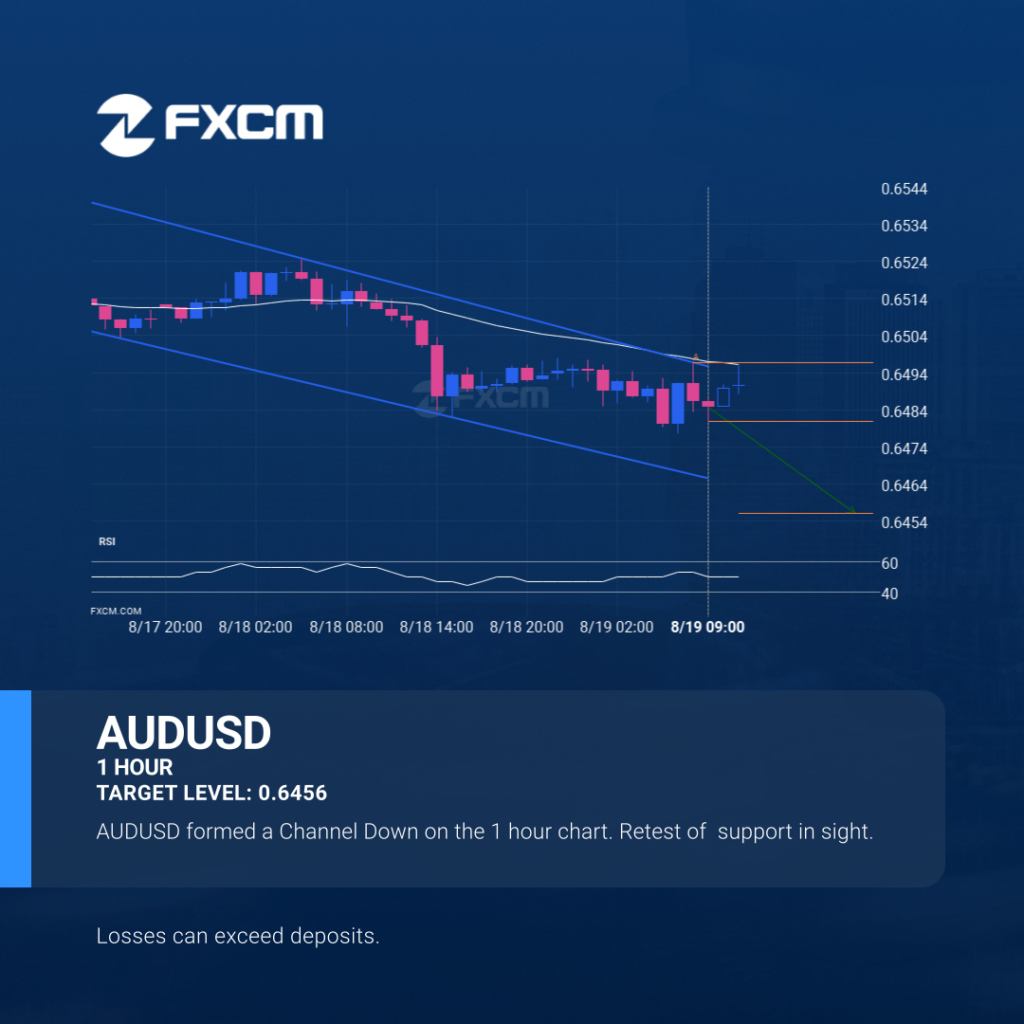
AUDUSD is heading towards the support line of a Channel Down and could reach this point within the next 10 hours. It has tested this line numerous times in the past, and this time could be no different from the past, ending in a rebound instead of a breakout. If the breakout doesn’t happen, we […]
Possible breach of support level by AUDUSD
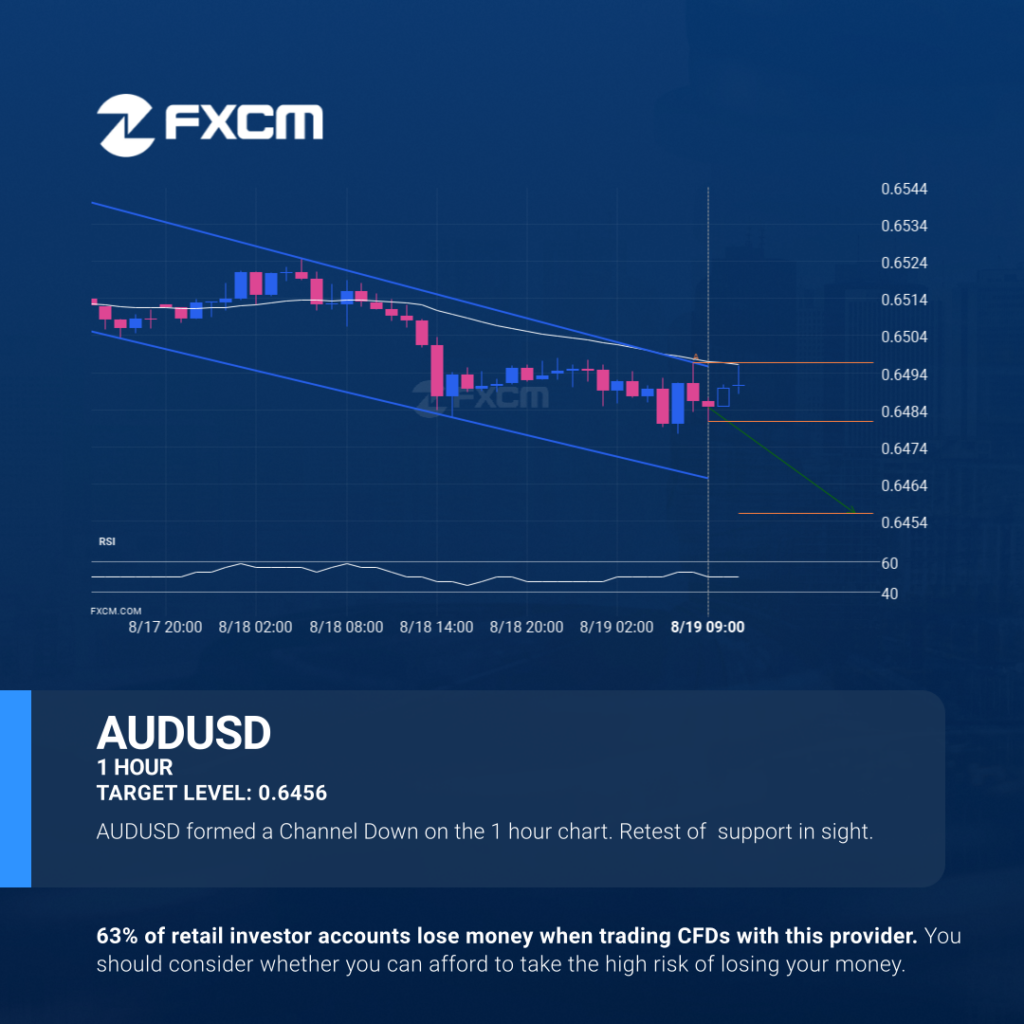
AUDUSD is heading towards the support line of a Channel Down and could reach this point within the next 10 hours. It has tested this line numerous times in the past, and this time could be no different from the past, ending in a rebound instead of a breakout. If the breakout doesn’t happen, we […]
Posible ruptura del nivel de soporte en el AUDUSD

El AUDUSD se dirige hacia la línea de soporte de un Canal bajista y puede alcanzar este punto en las próximas 10 horas. Ha probado esta línea ya en numerosas ocasiones en el pasado, y esta vez no tendría porqué ser diferente y terminar con una recuperación en lugar de una irrupción. Si ésta última […]
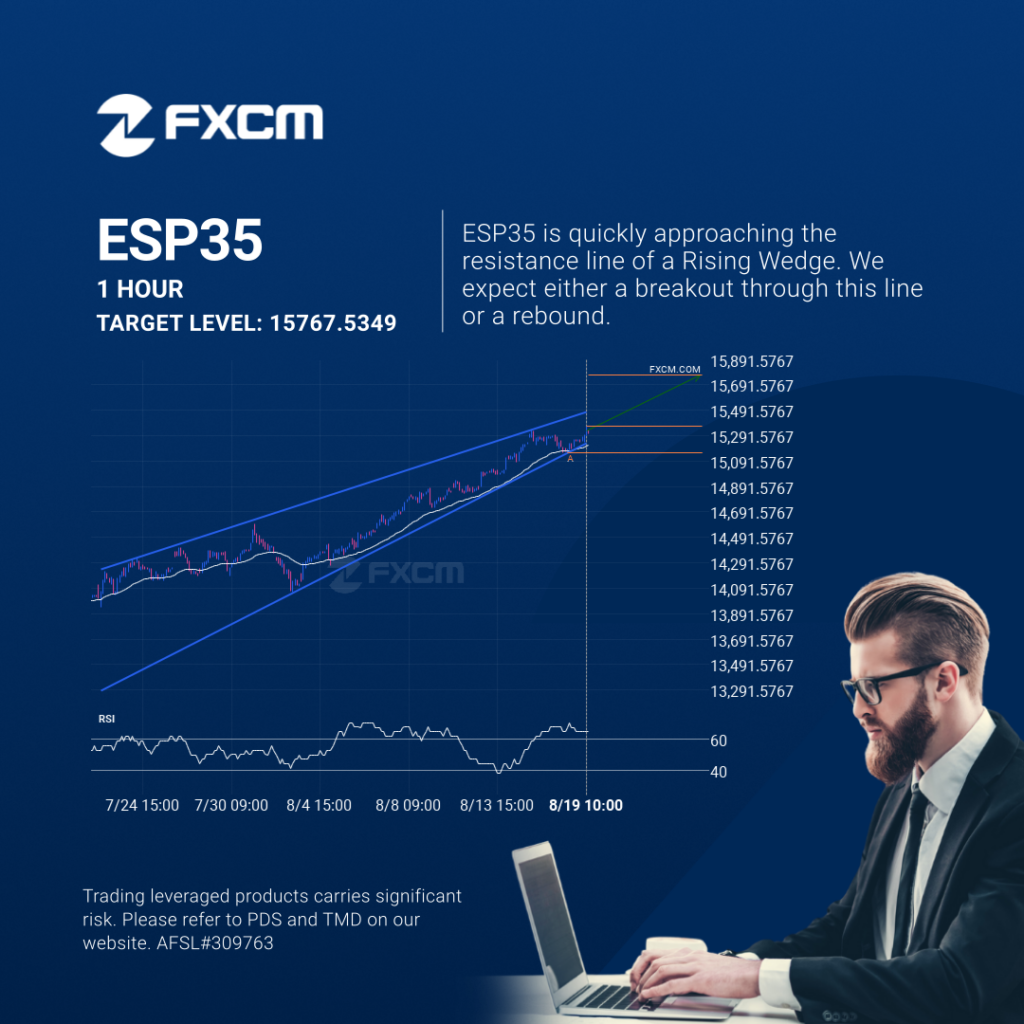
ESP35 approaching resistance of a Rising Wedge
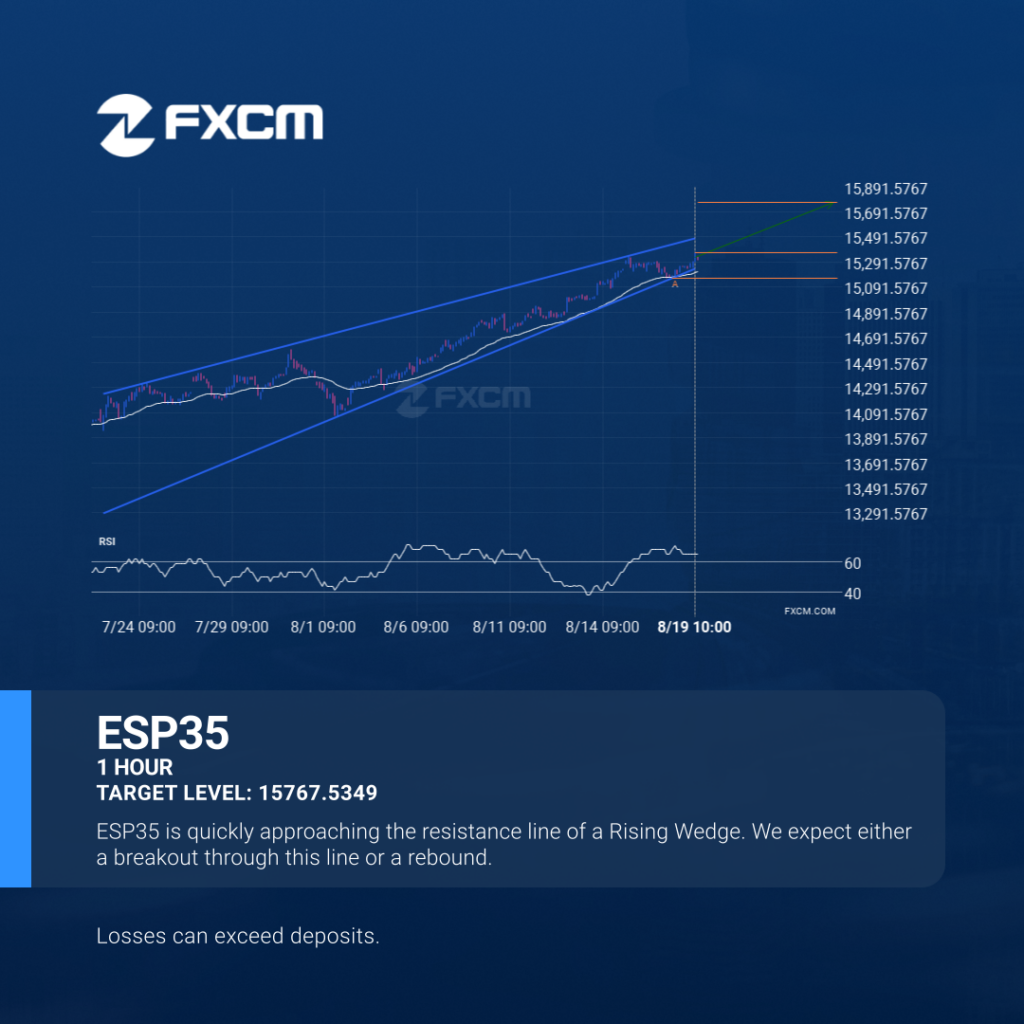
Emerging Rising Wedge detected on ESP35 – the pattern is an emerging one and has not yet broken through support, but the price is expected to move up over the next few hours. The price at the time the pattern was found was 15363.5 and it is expected to move to 15767.5349. Past performance is […]
El ESP35 se aproxima a la resistencia de un Cuña ascendente
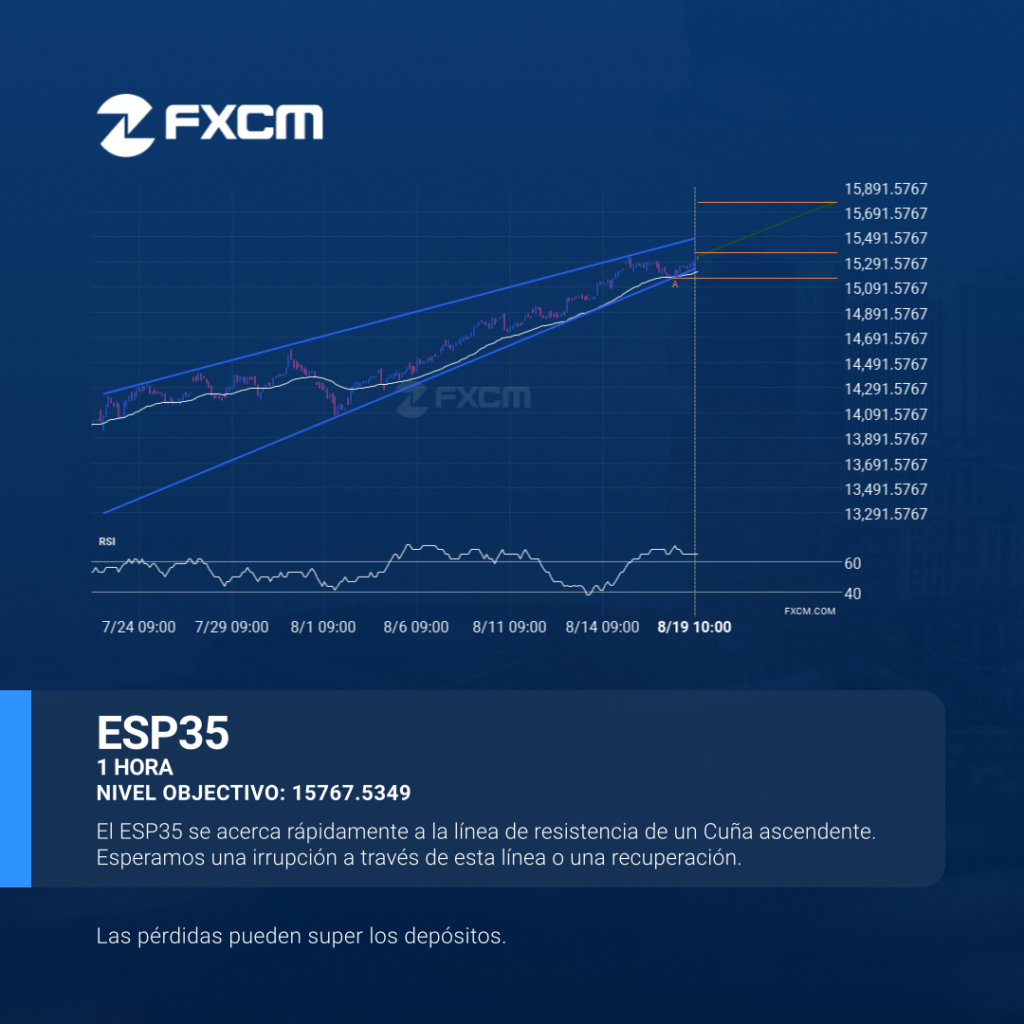
ESP35 se identificó alrededor de 15363.5 después de haber rebotado recientemente en un nivel de soporte en el intervalo temporal de 1 Hora. En última instancia, la acción del precio del activo ha formado un patrón de Cuña ascendente. Esta presión puede aumentar las posibilidades de una fuerte rotura. El movimiento proyectado potencialmente llevará el […]
ESP35 approaching resistance of a Rising Wedge
Emerging Rising Wedge detected on ESP35 – the pattern is an emerging one and has not yet broken through support, but the price is expected to move up over the next few hours. The price at the time the pattern was found was 15363.5 and it is expected to move to 15767.5349. Past performance is […]
HKG33 – Reversal Chart Pattern – Channel Down
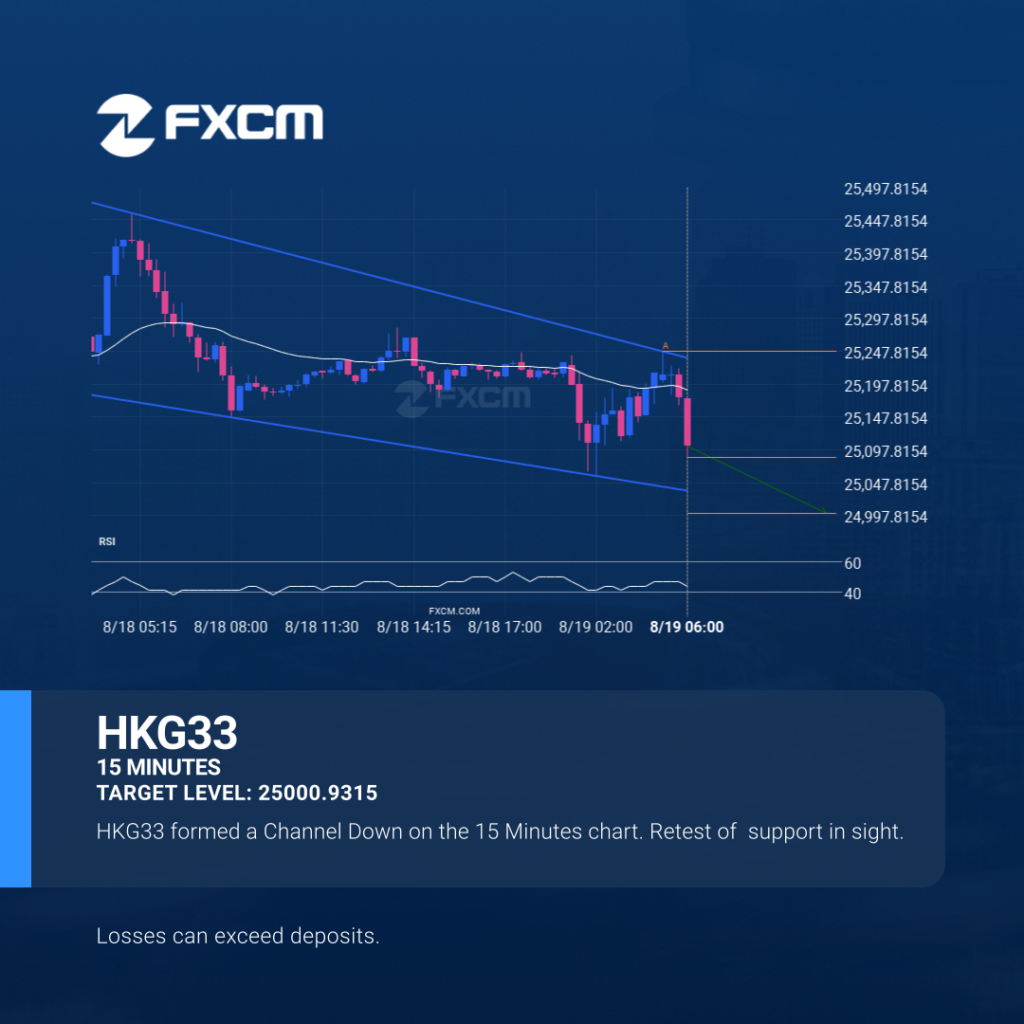
HKG33 is approaching the support line of a Channel Down. It has touched this line numerous times in the last 4 days. If it tests this line again, it should do so in the next 5 hours. Past performance is not an indicator of future results. Losses can exceed deposits.
Inminente recuperación o irrupción del BTCUSD
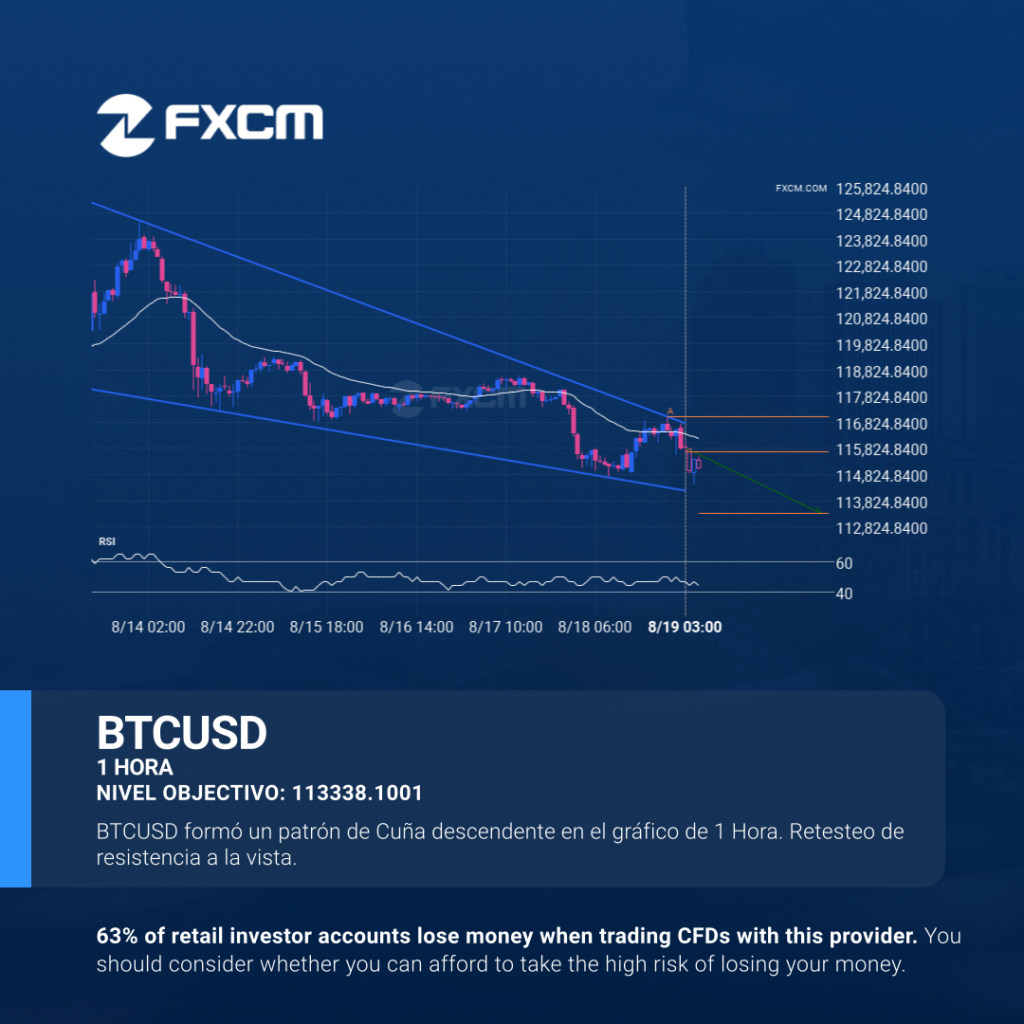
Se ha detectado un patrón Cuña descendente en formación en BTCUSD en el gráfico de 1 Hora. Existe la posibilidad de un movimiento hacia 113338.1001 en las próximas velas. Una vez que alcance resistance, el precio puede continuar su tendencia bajista o revertir a los niveles actuales de precio. El rendimiento pasado no es indicativo […]
NZDUSD is on the approach
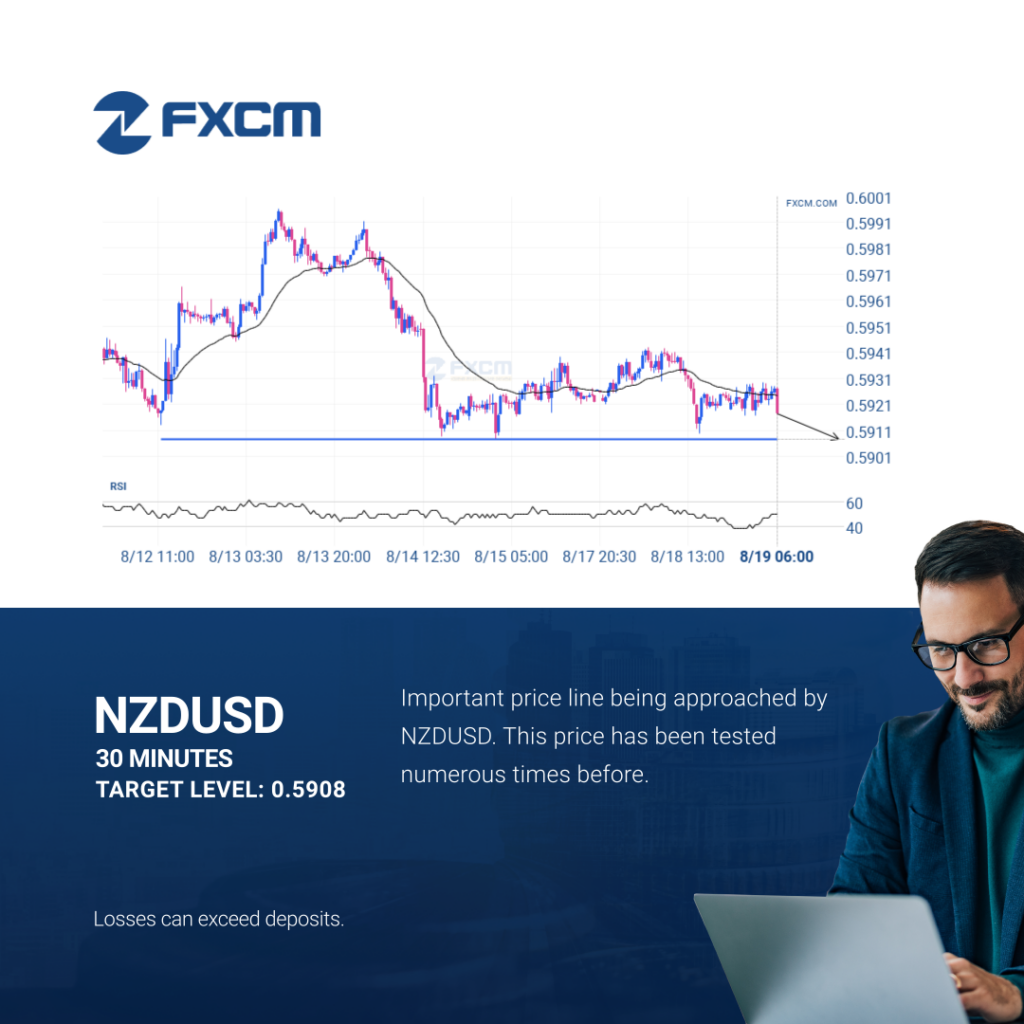
NZDUSD is approaching a support line at 0.5908. If it hits the support line, it may break through this level to continue the bearish trend, or it may turn around back to current levels. Past performance is not an indicator of future results. Losses can exceed deposits.
HKG33 – Reversal Patrón de gráfico – Canal bajista
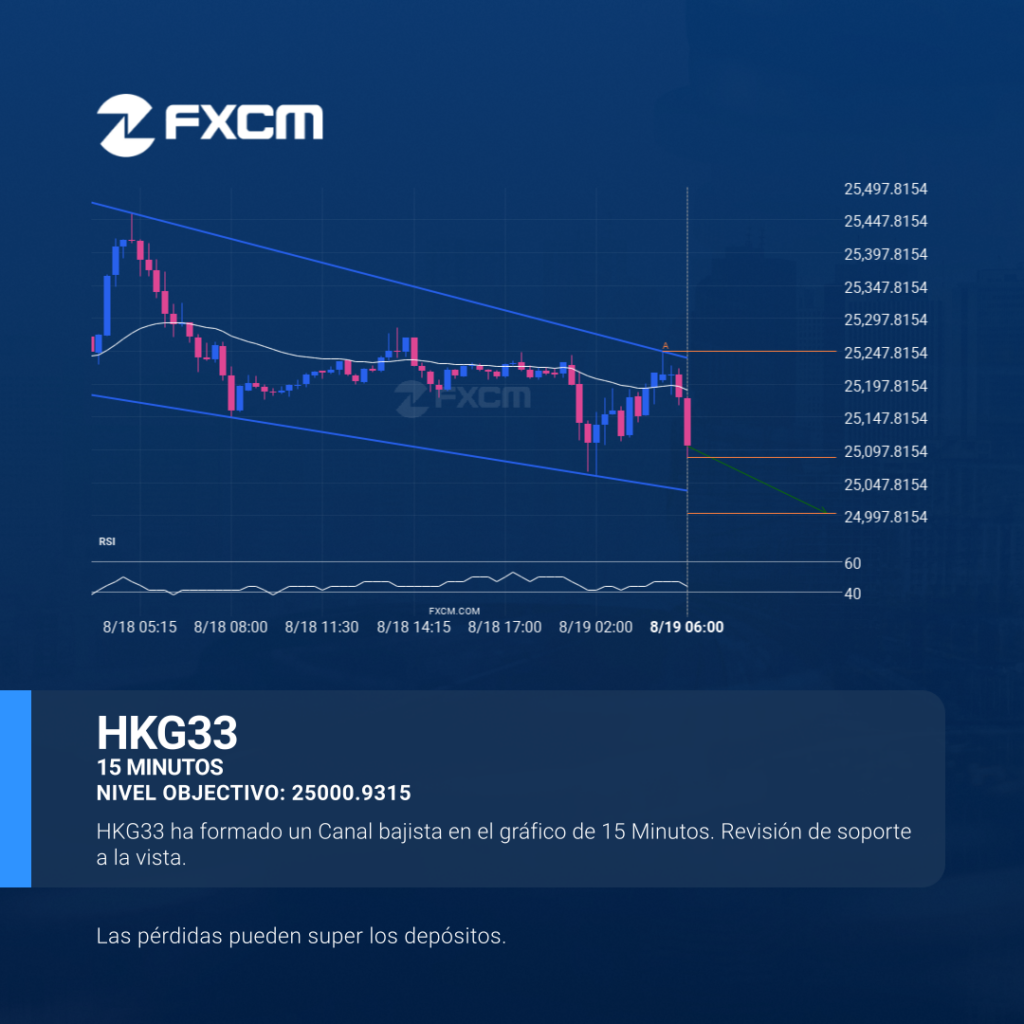
El HKG33 se está acercando a la línea de soporte de un Canal bajista. Ha llegado a esta línea en numerosas ocasiones durante los últimos 4 días. Si vuelve a probarla de nuevo, debería hacerlo en las próximas 5 horas. El rendimiento pasado no es indicativo de resultados futuros. Las pérdidas pueden exceder los fondos […]