ESP35 – Continuation Patrón de gráfico – Canal alcista
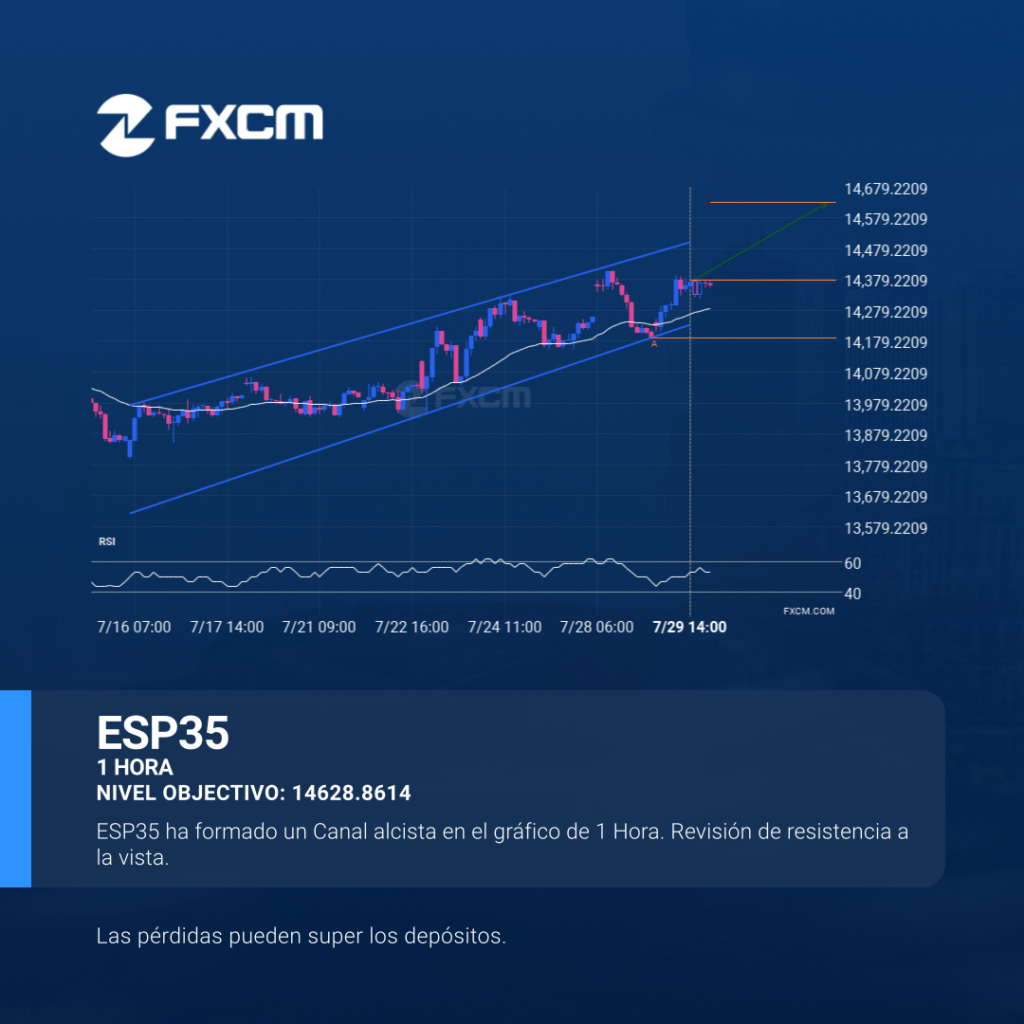
El ESP35 se dirige hacia la línea de resistencia de un Canal alcista y puede alcanzar este punto en las próximas 2 días. Ha probado esta línea ya en numerosas ocasiones en el pasado, y esta vez no tendría porqué ser diferente y terminar con una recuperación en lugar de una irrupción. Si ésta última […]
Important price line breached by USDCAD
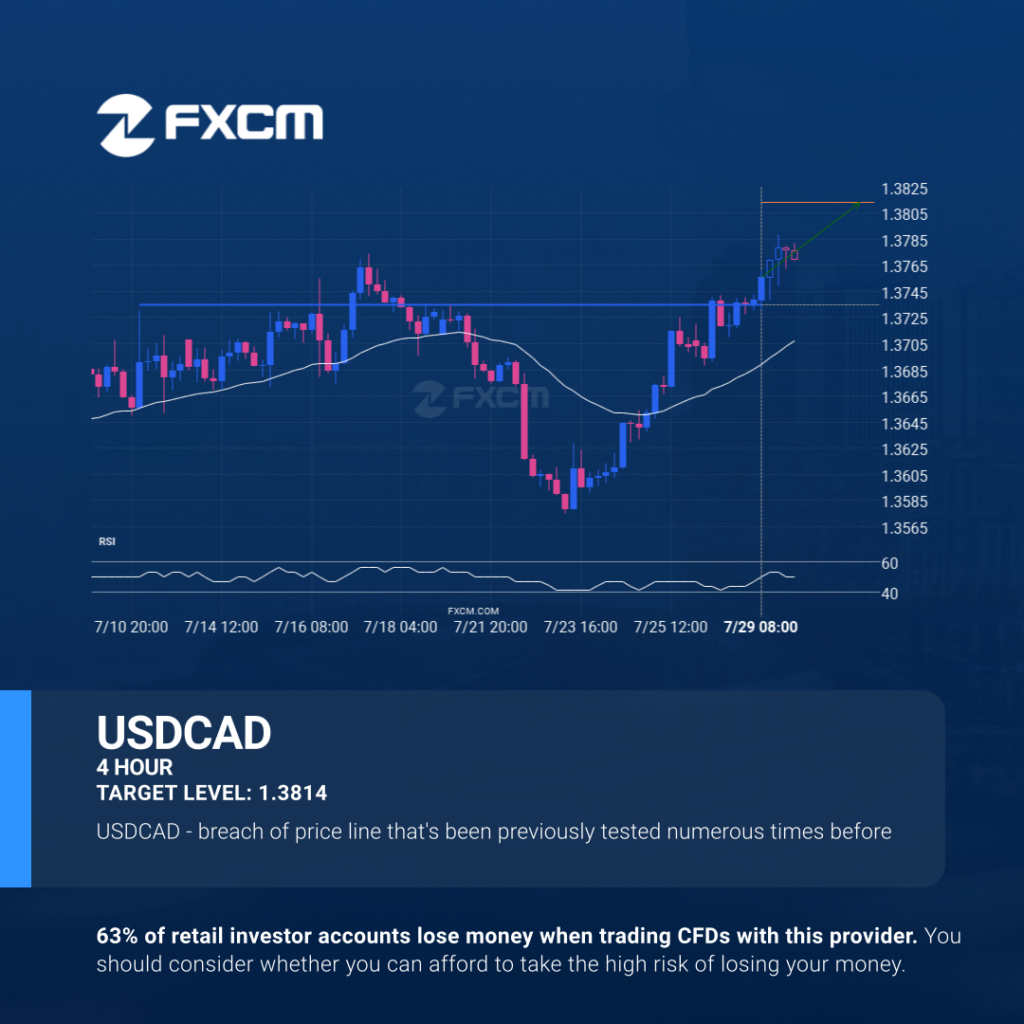
USDCAD is once again retesting a key horizontal resistance level at 1.3735. It has tested this level 4 times in the recent past and could simply bounce off like it did last time. However, after this many tries, maybe it’s ready to start a new trend. Past performance is not an indicator of future results. […]
Important price line breached by USDCAD
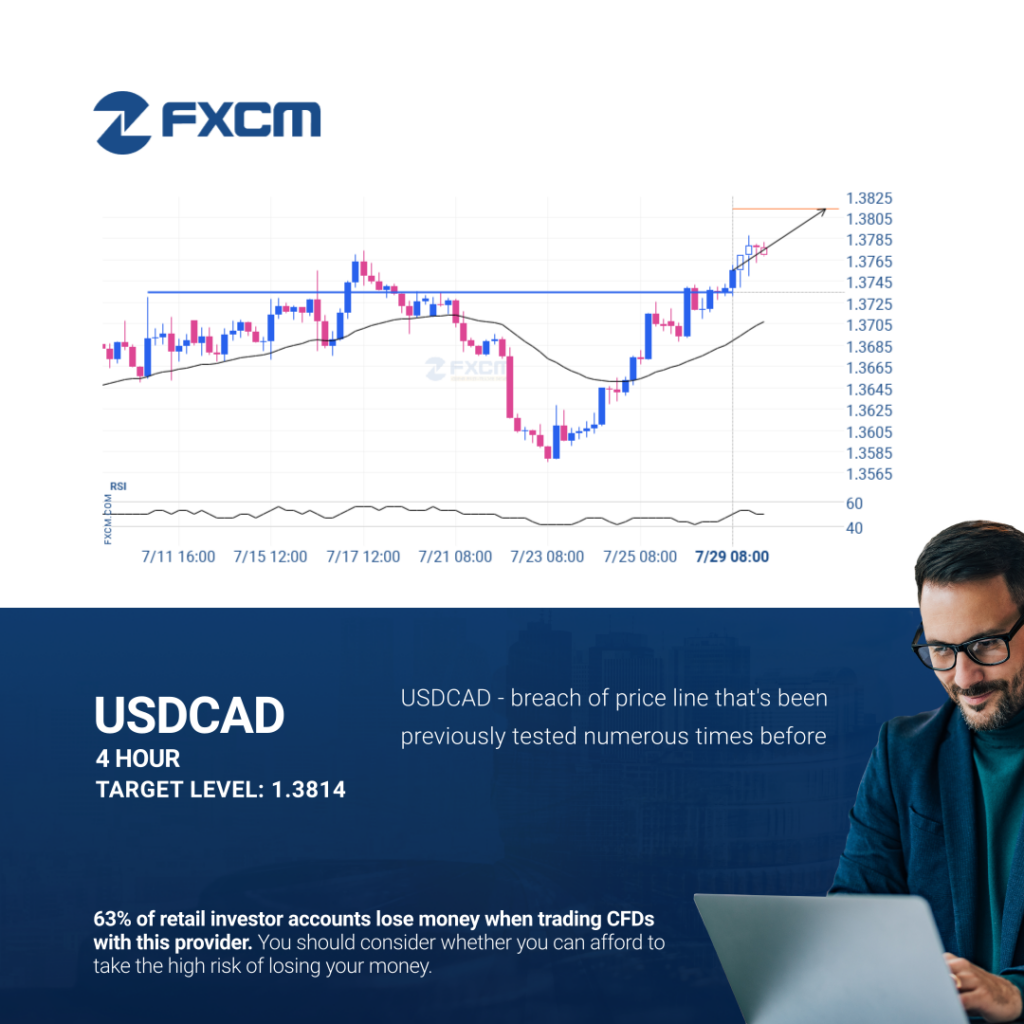
USDCAD is once again retesting a key horizontal resistance level at 1.3735. It has tested this level 4 times in the recent past and could simply bounce off like it did last time. However, after this many tries, maybe it’s ready to start a new trend. Past performance is not an indicator of future results. […]
Important price line breached by USDCAD
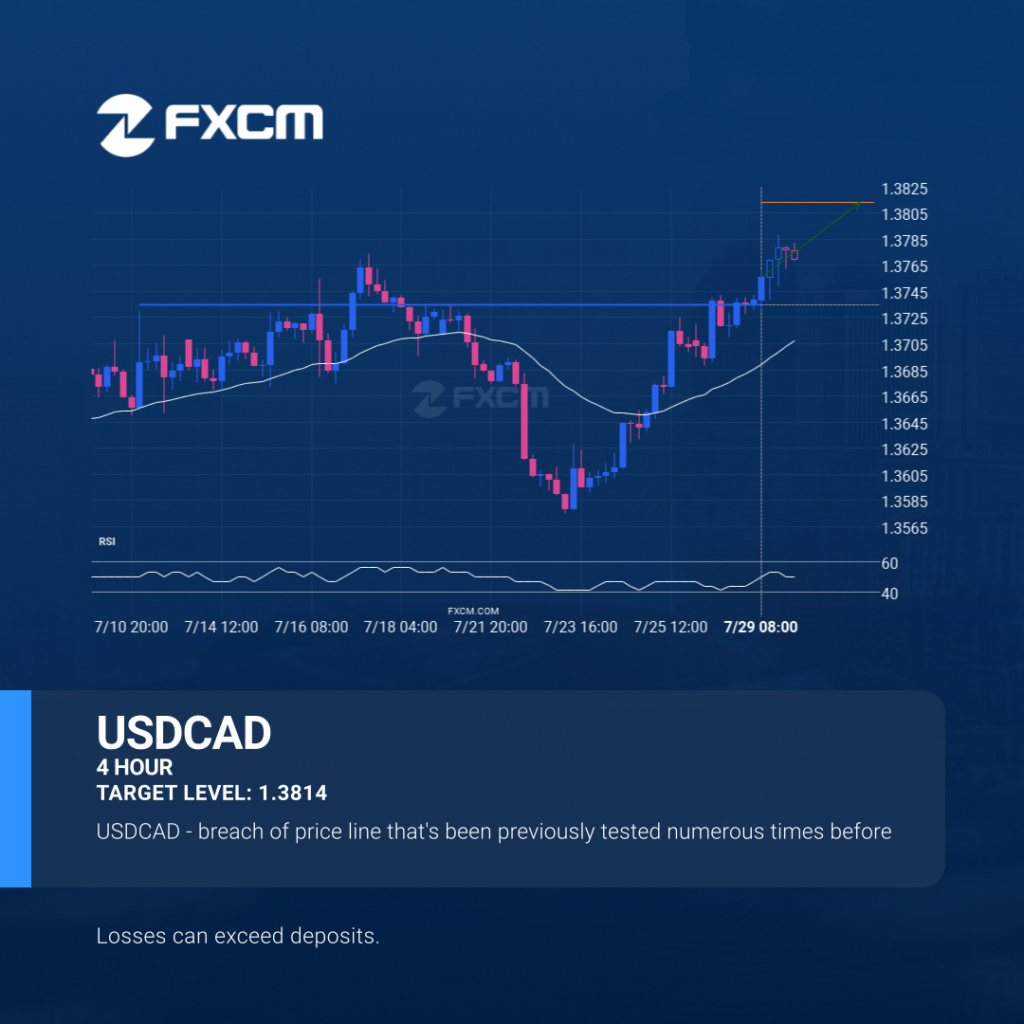
USDCAD is once again retesting a key horizontal resistance level at 1.3735. It has tested this level 4 times in the recent past and could simply bounce off like it did last time. However, after this many tries, maybe it’s ready to start a new trend. Past performance is not an indicator of future results. […]
Importante línea de precio atravesada por el USDCAD
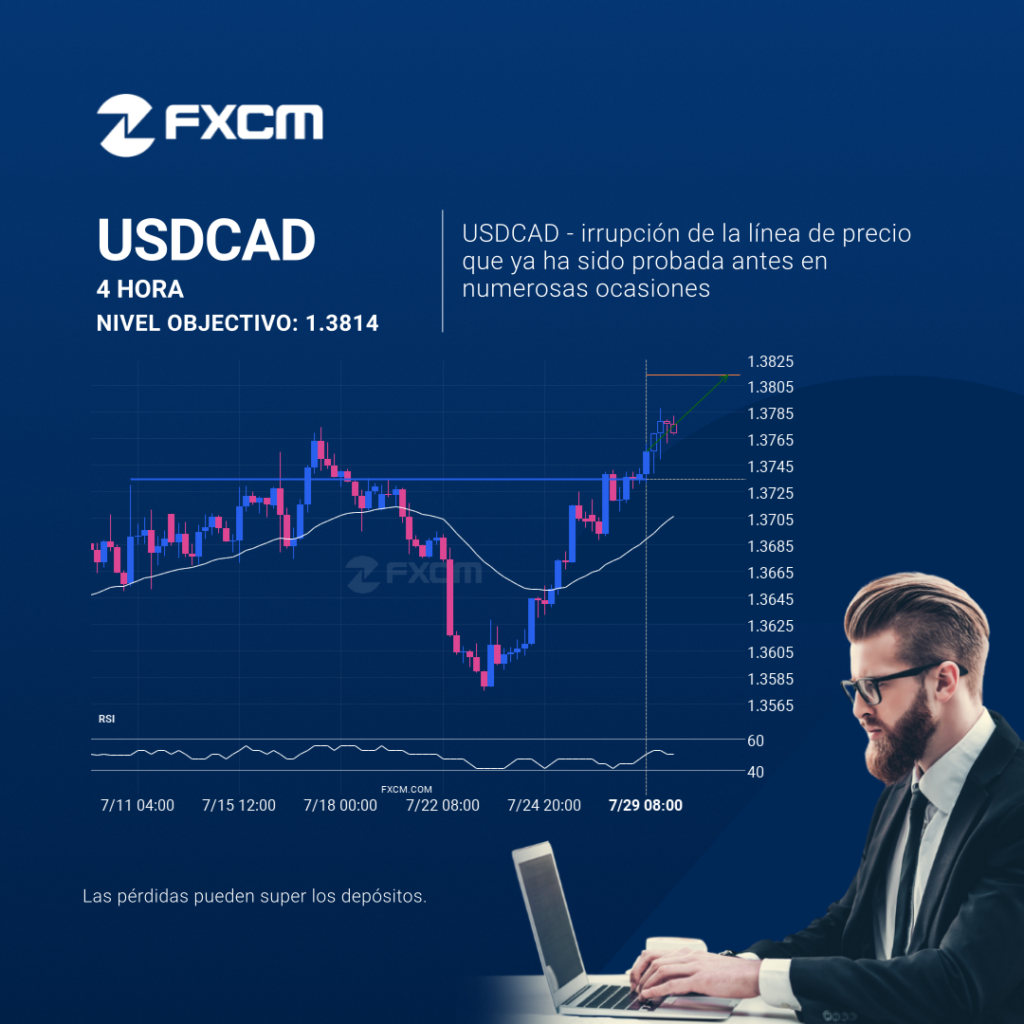
USDCAD está testeando una vez más el nivel clave de resistencia horizontal en 1.3735. Ha testeado este nivel 4 veces recientemente y podría simplemente rebotar como lo hizo la última vez. Sin embargo, después de tantos intentos, tal vez esté a punto para empezar una nueva tendencia. El rendimiento pasado no es indicativo de resultados […]
Either a rebound or a breakout imminent on AUDUSD

AUDUSD is heading towards the support line of a Channel Down and could reach this point within the next 10 hours. It has tested this line numerous times in the past, and this time could be no different from the past, ending in a rebound instead of a breakout. If the breakout doesn’t happen, we […]
Inminente recuperación o irrupción del AUDUSD

El AUDUSD se dirige hacia la línea de soporte de un Canal bajista y puede alcanzar este punto en las próximas 10 horas. Ha probado esta línea ya en numerosas ocasiones en el pasado, y esta vez no tendría porqué ser diferente y terminar con una recuperación en lugar de una irrupción. Si ésta última […]
¿Tendrá el HKG33 suficiente impulso como para irrumpir la resistencia?
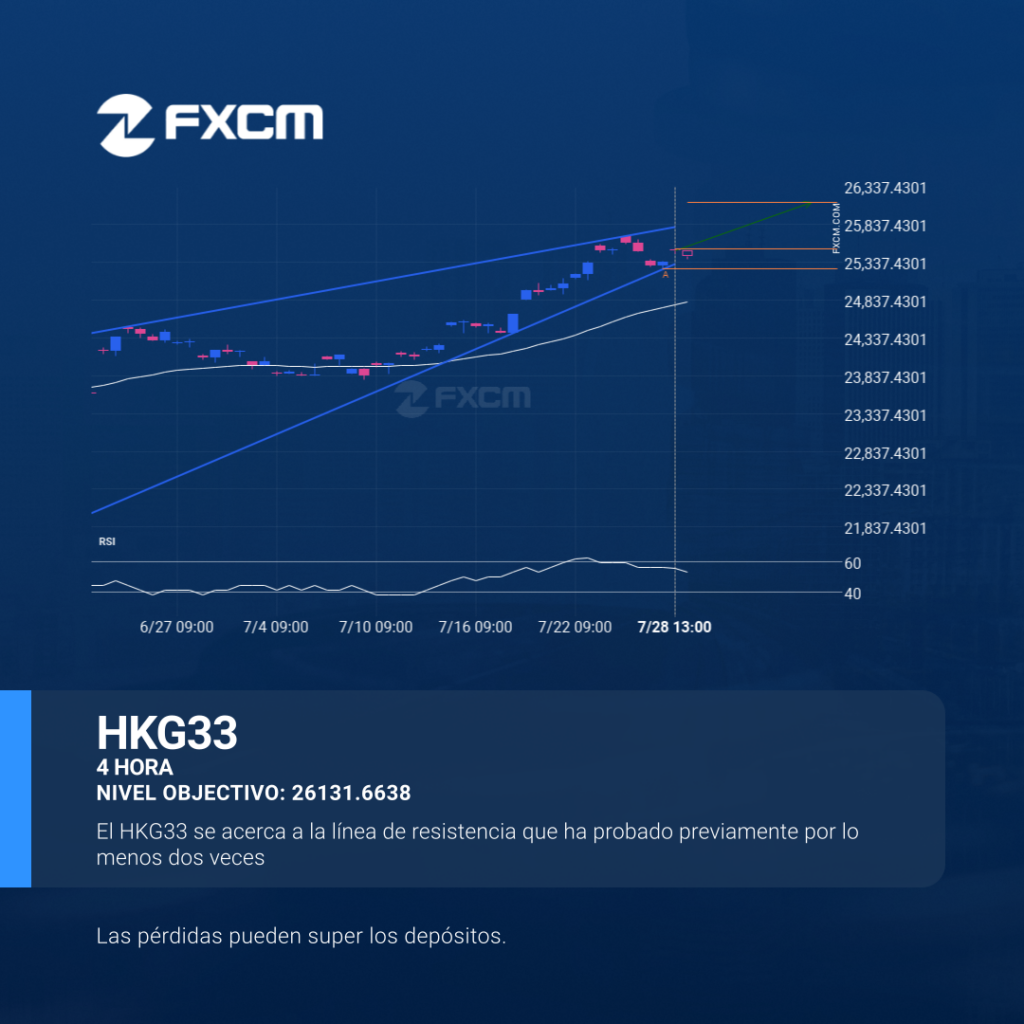
Se identificó un patrón de Cuña ascendente en HKG33 en 25519.68, lo que generó la expectativa de que podría moverse a la línea de resistencia en 26131.6638. Puede atravesar esa línea y continuar la tendencia alcista o puede girarse desde esa línea. El rendimiento pasado no es indicativo de resultados futuros. Las pérdidas pueden exceder […]
USDCHF – resistance line broken at 2025-07-28T10:00:00.000Z
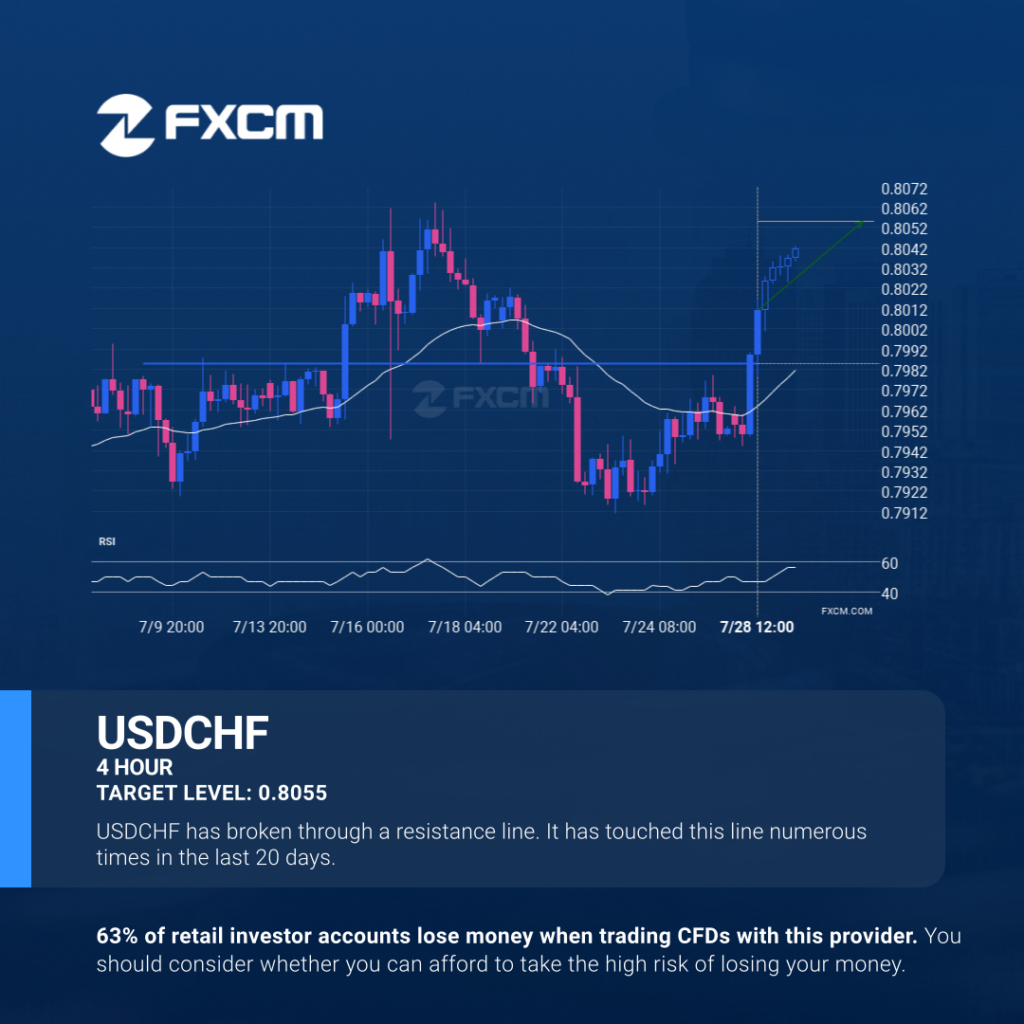
The breakout of USDCHF through the 0.7985 price line is a breach of an important psychological price that is has tested numerous in the past. If this breakout persists, USDCHF could test 0.8055 within the next 3 days. One should always be cautious before placing a trade, wait for confirmation of the breakout. Past performance […]
USDCHF: línea de resistencia rota a las 2025-07-28T10:00:00.000Z

La rotura del USDCHF a través de la línea de precio en 0.7985 es una brecha de un importante precio psicológico que se ha probado numerosas veces en el pasado. Si esta rotura persiste, el USDCHF podría probar el nivel de 0.8055 durante las siguientes 3 días. Habría que ser prudentes antes de ejecutar una […]