A potential bullish movement on EURCHF
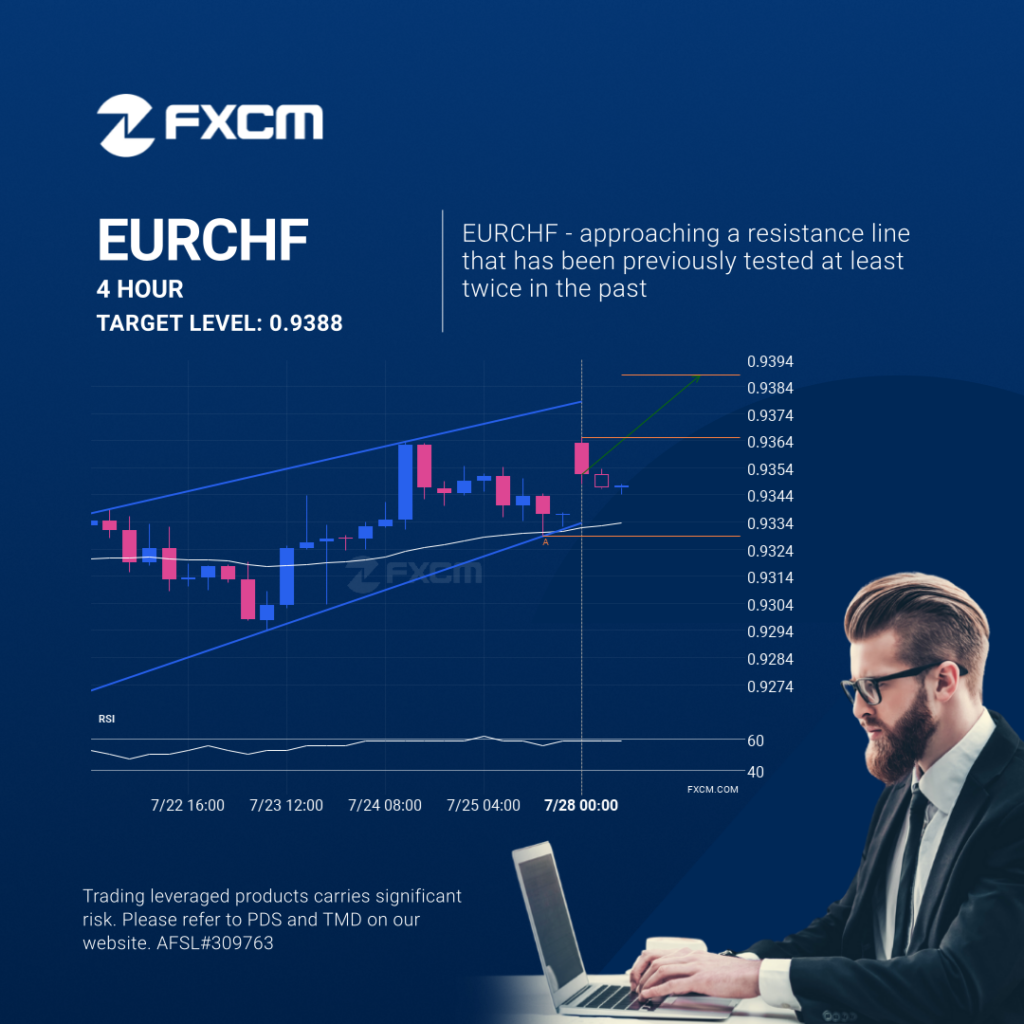
EURCHF was identified at around 0.936485 having recently rebounded of the support on the 4 hour data interval. Ultimately, the price action of the stock has formed a Rising Wedge pattern. This squeeze may increases the chances of a strong breakout. The projected movement will potentially take the price to around the 0.9388 level. Past […]
EURCHF – Patrón de gráfico Continuation – Cuña ascendente
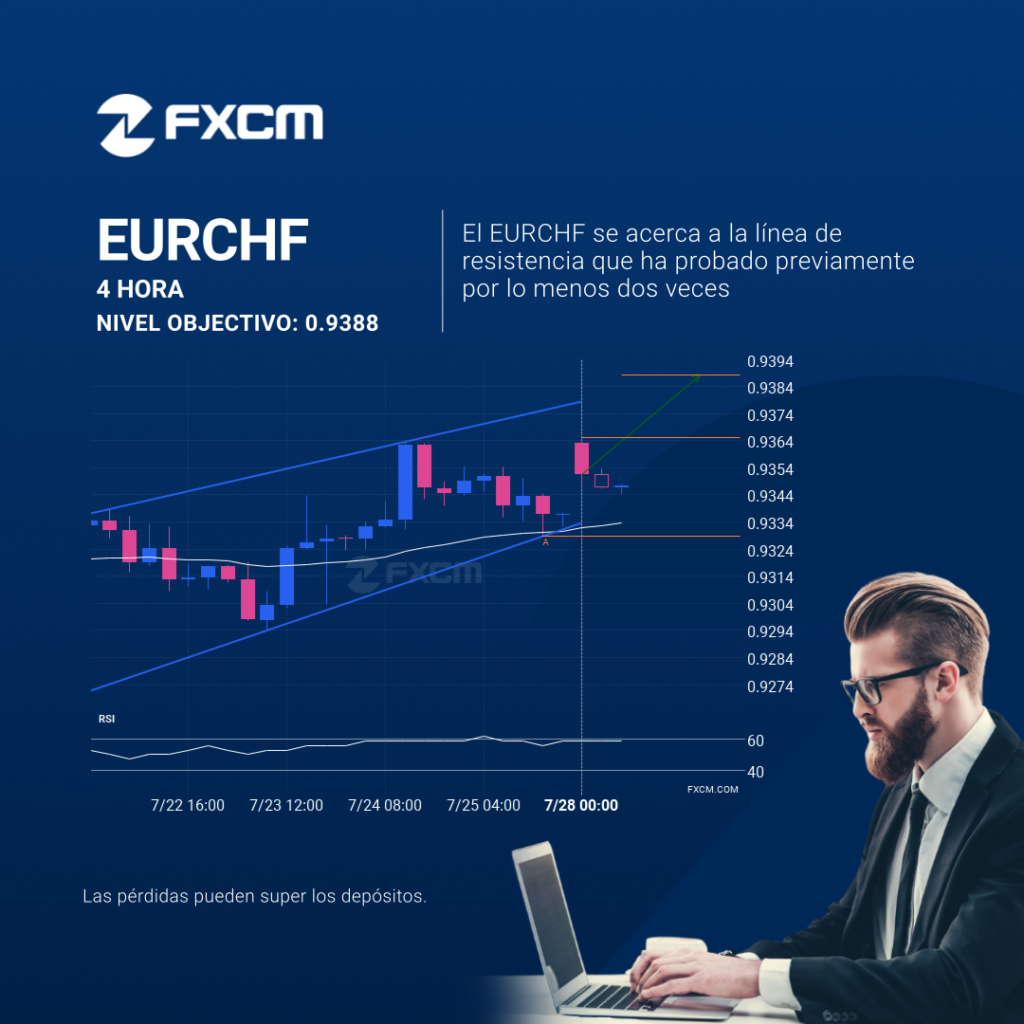
Se identificó un patrón de Cuña ascendente en EURCHF en 0.936485, lo que generó la expectativa de que podría moverse a la línea de resistencia en 0.9388. Puede atravesar esa línea y continuar la tendencia alcista o puede girarse desde esa línea. El rendimiento pasado no es indicativo de resultados futuros. Las pérdidas pueden exceder […]
A potential bullish movement on HKG33

A Channel Up pattern was identified on HKG33 at 25643.7, creating an expectation that it may move to the resistance line at 26371.9909. It may break through that line and continue the bullish trend or it may reverse from that line. Past performance is not an indicator of future results. Trading leveraged products carries significant […]
A potential bullish movement on EURCHF
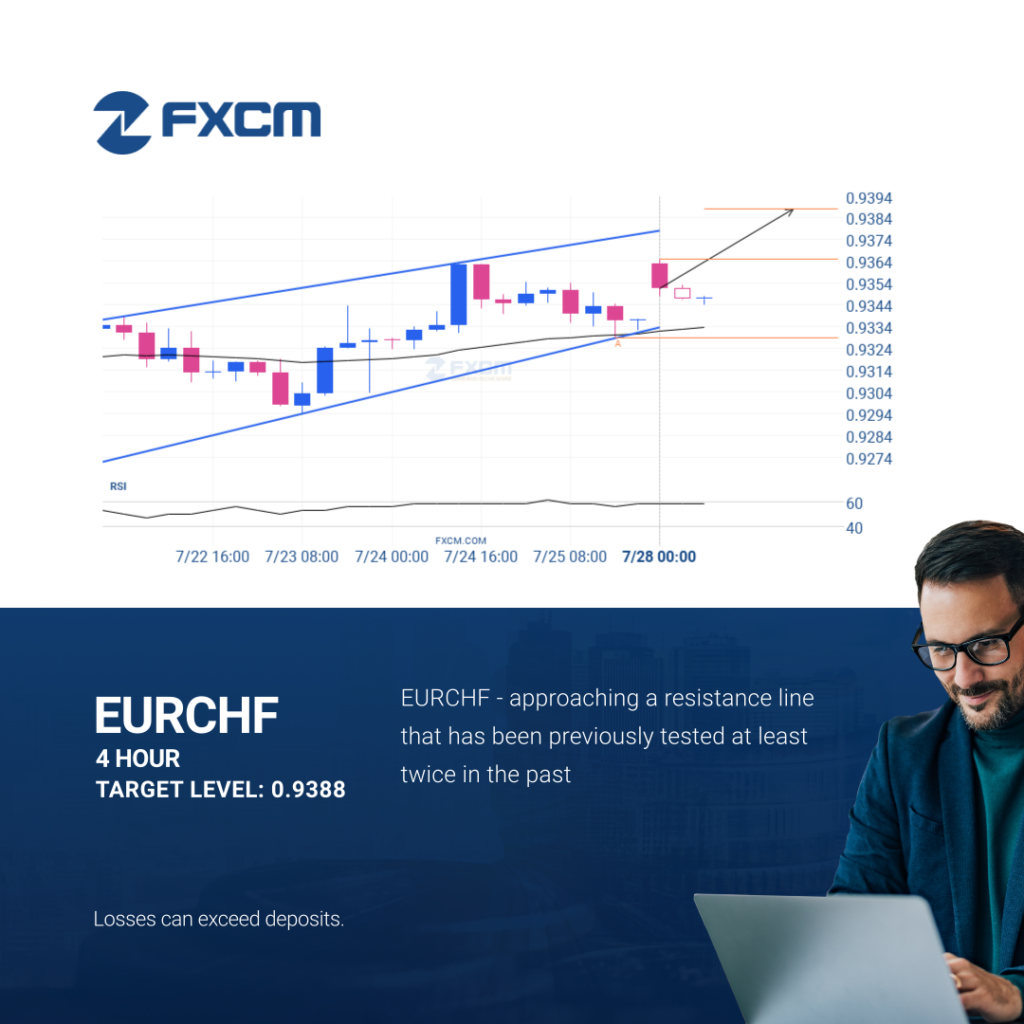
EURCHF was identified at around 0.936485 having recently rebounded of the support on the 4 hour data interval. Ultimately, the price action of the stock has formed a Rising Wedge pattern. This squeeze may increases the chances of a strong breakout. The projected movement will potentially take the price to around the 0.9388 level. Past […]
A possible start of a bearish trend on AUDUSD
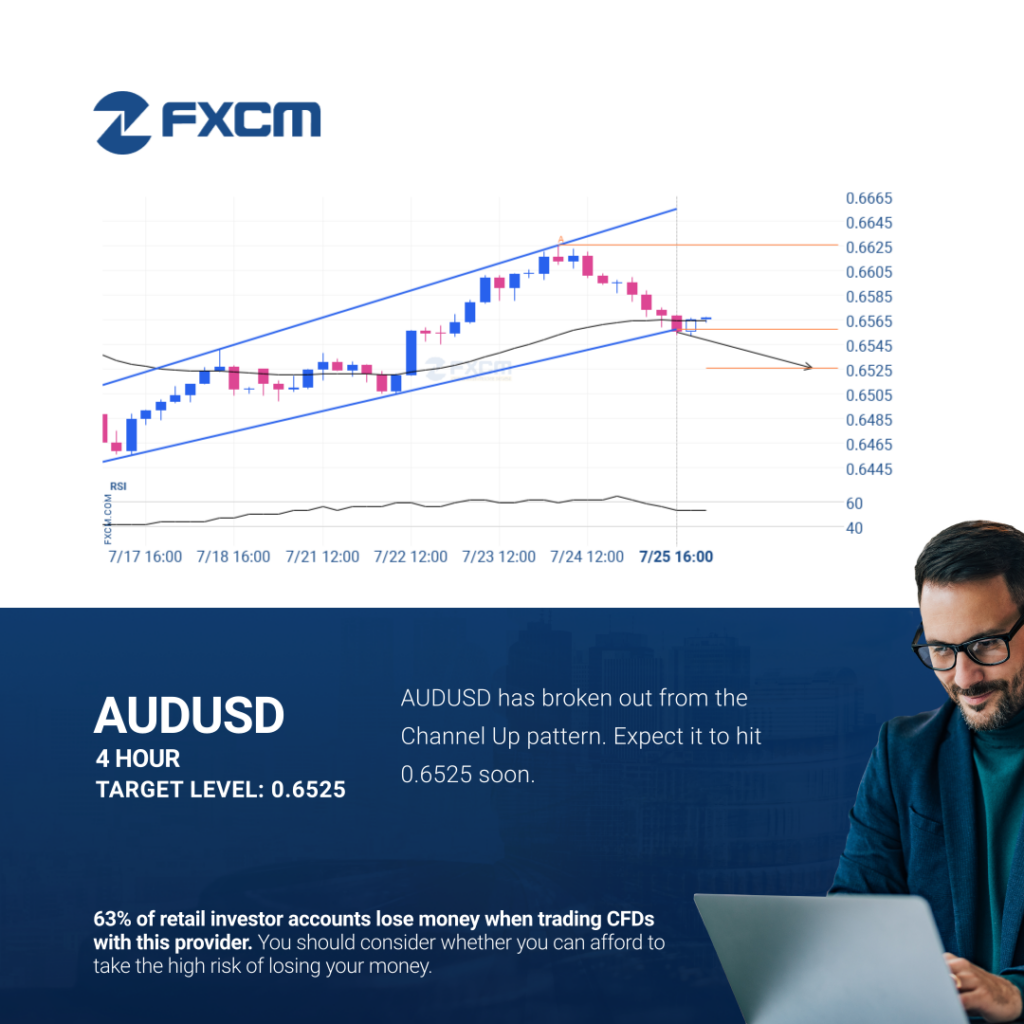
AUDUSD has broken through a support line. It has touched this line at least twice in the last 11 days. This breakout may indicate a potential move to 0.6525 within the next 2 days. Because we have seen it retrace from this position in the past, one should wait for confirmation of the breakout before […]
Un posible comienzo de una tendencia bajista en el AUDUSD
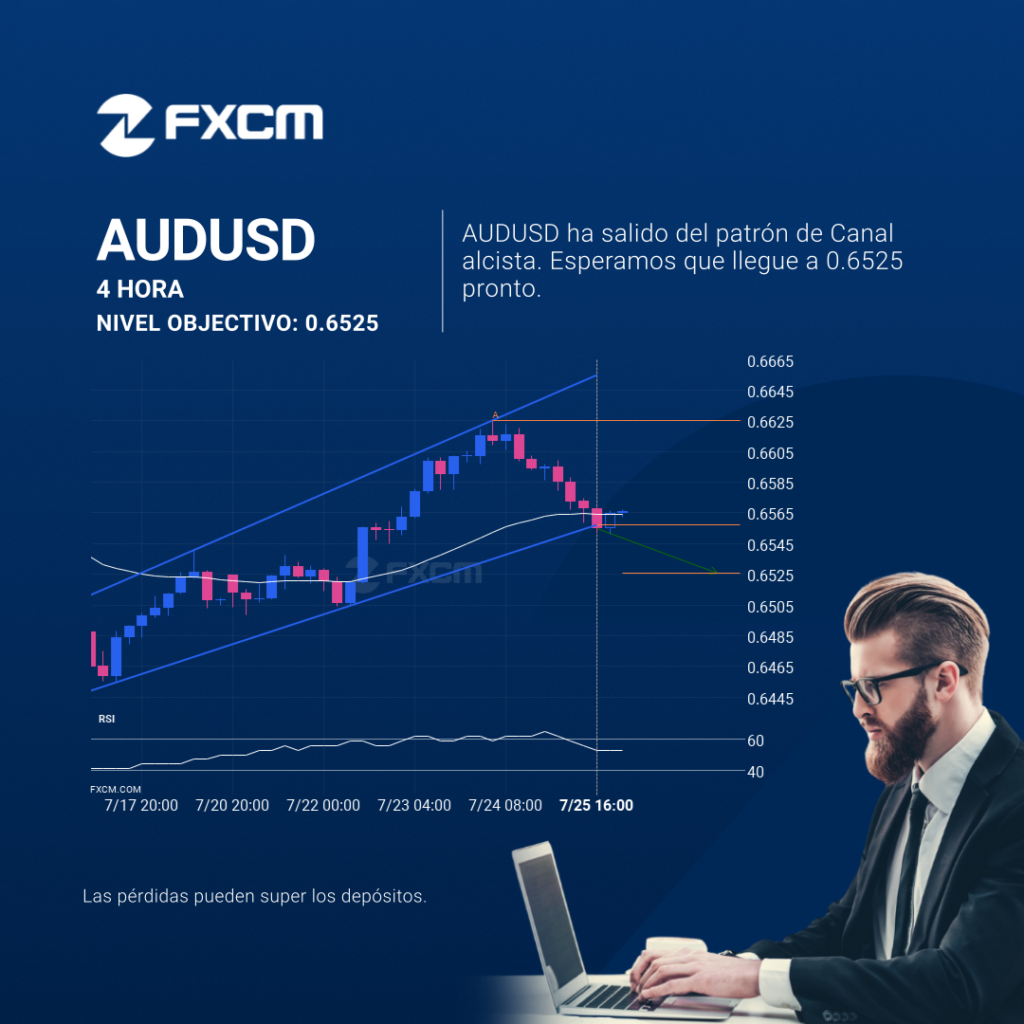
El AUDUSD atravesó una línea de soporte. Ha entrado en contacto con esta línea por lo menos dos veces en 11 días. Esta ruptura puede indicar un movimiento potencial a 0.6525 en 2 días. Como ya vimos un retroceso de esta posición en el pasado, debemos esperar la confirmación de la ruptura antes de operar. […]
A possible start of a bearish trend on AUDUSD
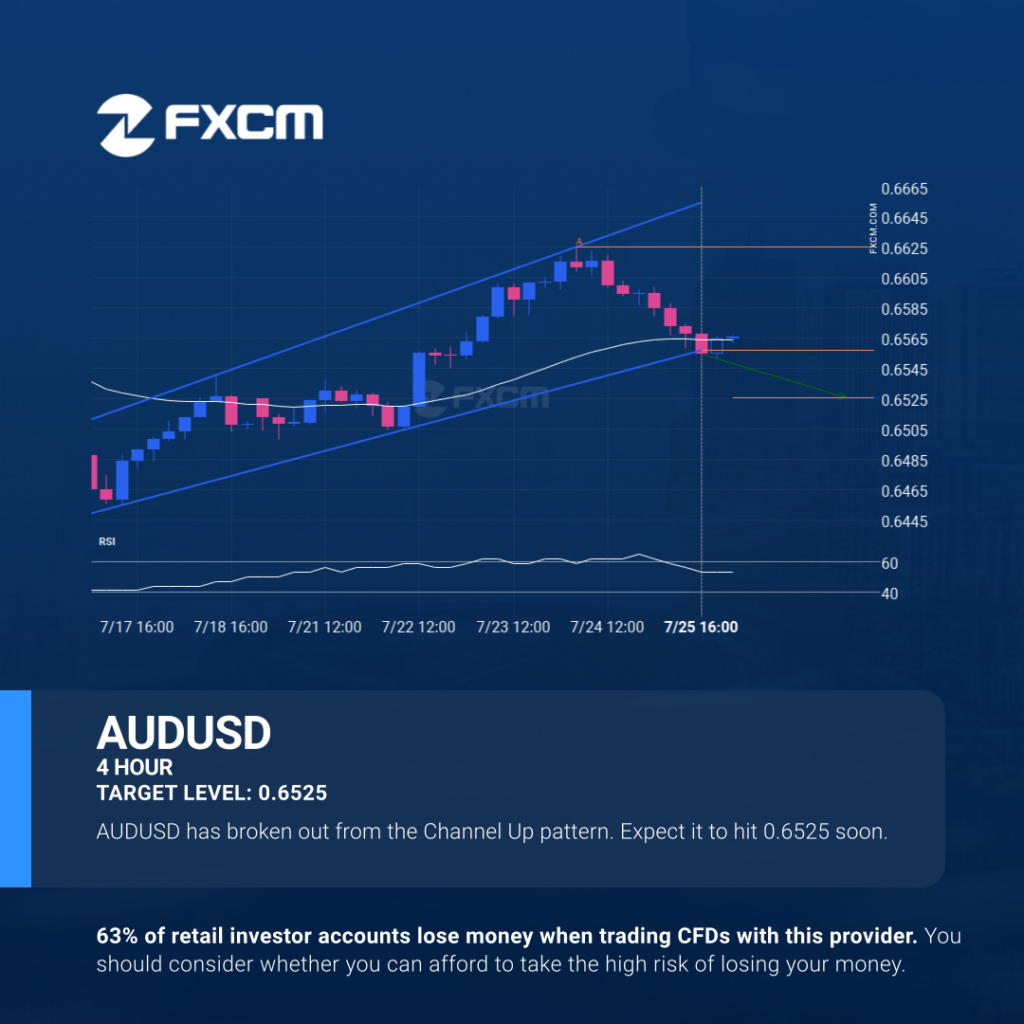
AUDUSD has broken through a support line. It has touched this line at least twice in the last 11 days. This breakout may indicate a potential move to 0.6525 within the next 2 days. Because we have seen it retrace from this position in the past, one should wait for confirmation of the breakout before […]
BTCUSD acercándose a nivel de resistencia
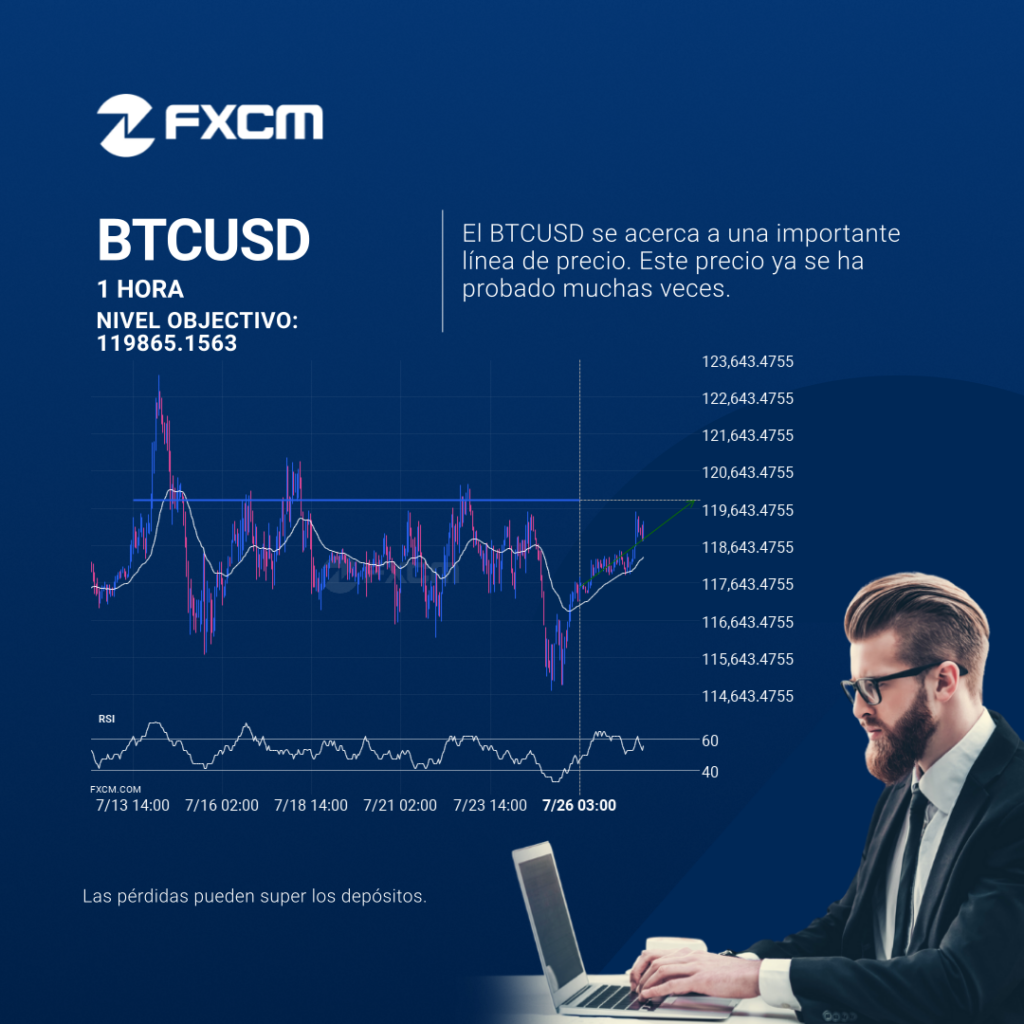
BTCUSD está a punto de volver a testear un nivel de resistencia horizontal clave, cerca de 119865.1563. Ha testeado este nivel 6 veces recientemente y podría simplemente rebotar como lo hizo la última vez. Sin embargo, después de tantos intentos, tal vez esté listo para empezar una nueva tendencia. El rendimiento pasado no es indicativo […]
Un posible movimiento alcista en ESP35
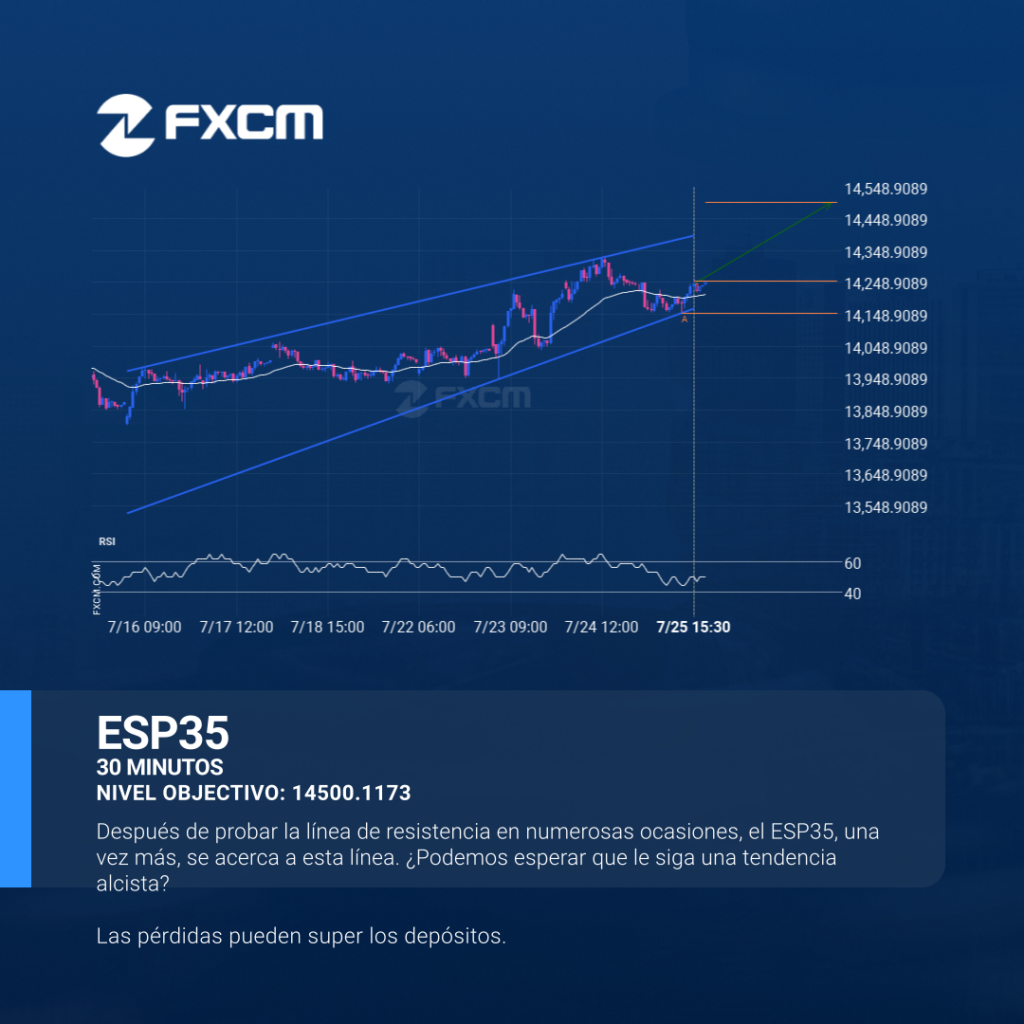
El ESP35 se dirige hacia la línea de resistencia de un Cuña ascendente y puede alcanzar este punto en las próximas 2 días. Ha probado esta línea ya en numerosas ocasiones en el pasado, y esta vez no tendría porqué ser diferente y terminar con una recuperación en lugar de una irrupción. Si ésta última […]
A potential bullish movement on ESP35
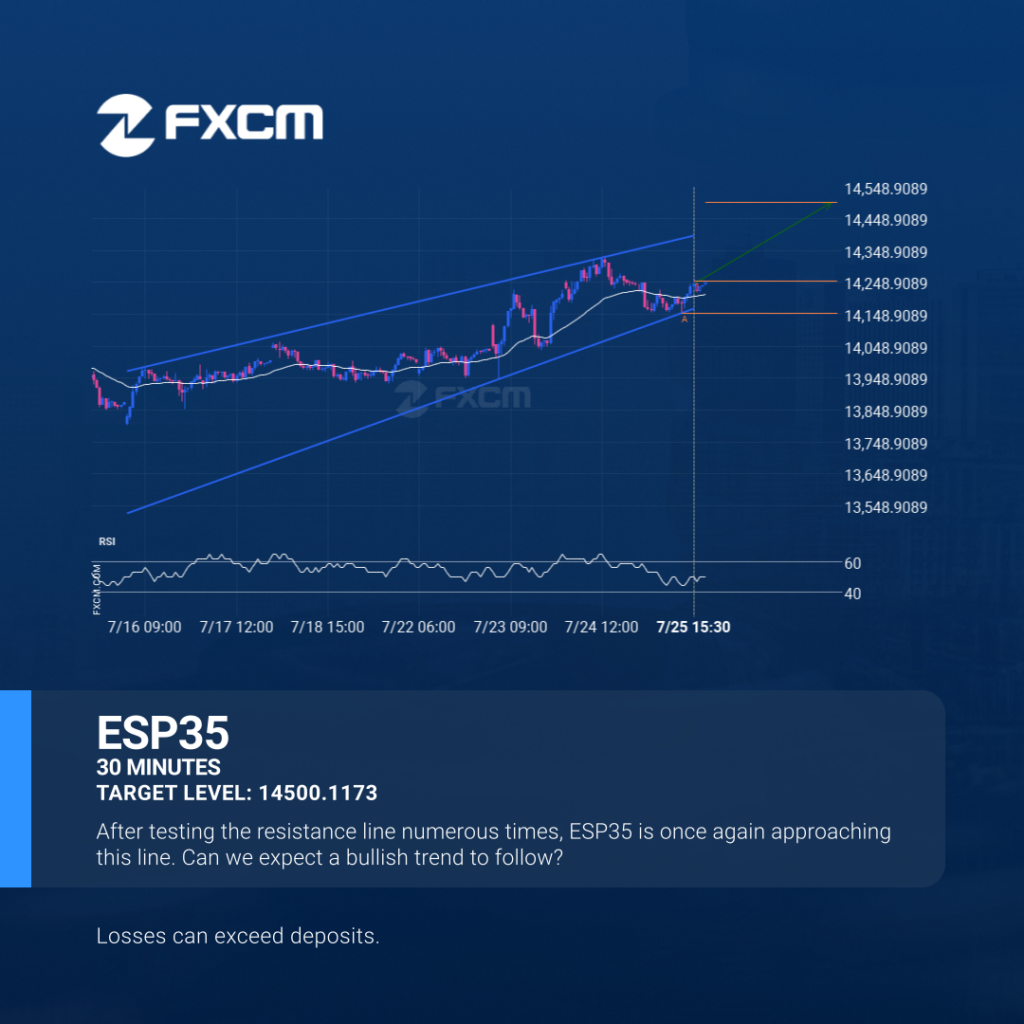
ESP35 is heading towards the resistance line of a Rising Wedge and could reach this point within the next 2 days. It has tested this line numerous times in the past, and this time could be no different from the past, ending in a rebound instead of a breakout. If the breakout doesn’t happen, we […]