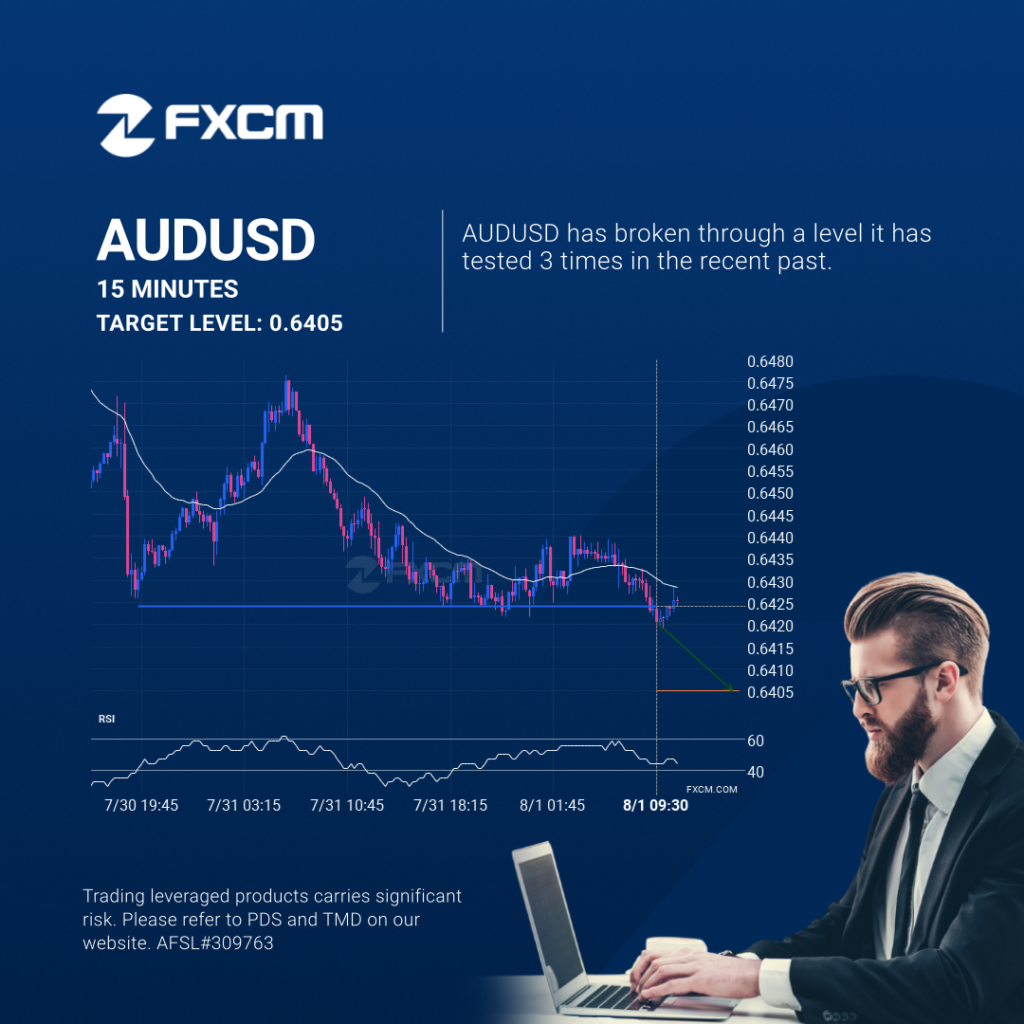
AUDUSD breakout through support

The price of AUDUSD in heading in the direction of 0.6405. Despite the recent breakout through 0.6424 it is possible that it will struggle to gain momentum to the forecast price and move back in the other direction. This has happened many times in the past so watch for a possible bounce back. Past performance […]
AUDUSD breakout through support
The price of AUDUSD in heading in the direction of 0.6405. Despite the recent breakout through 0.6424 it is possible that it will struggle to gain momentum to the forecast price and move back in the other direction. This has happened many times in the past so watch for a possible bounce back. Past performance […]
BTCUSD – Reversal Patrón de gráfico – Cuña descendente
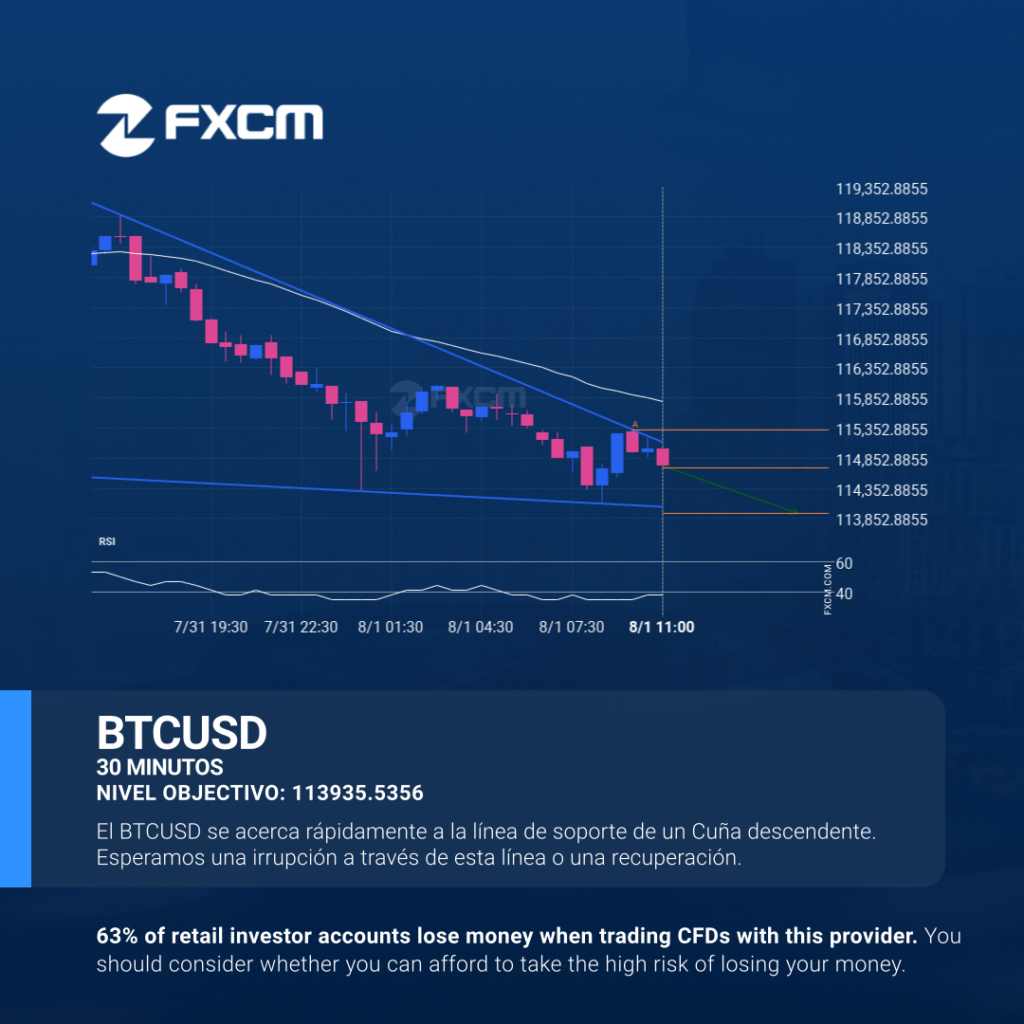
El BTCUSD avanza hacia una línea de soporte. Como le hemos visto retroceder desde esta línea anteriormente, podríamos presenciar, o bien, una ruptura a través de esta línea o una recuperación a los niveles actuales. Ha llegado a esta línea en numerosas ocasiones en los últimos 20 horas y puede probarla de nuevo en las […]
Should we expect a breakout or a rebound on ESP35?
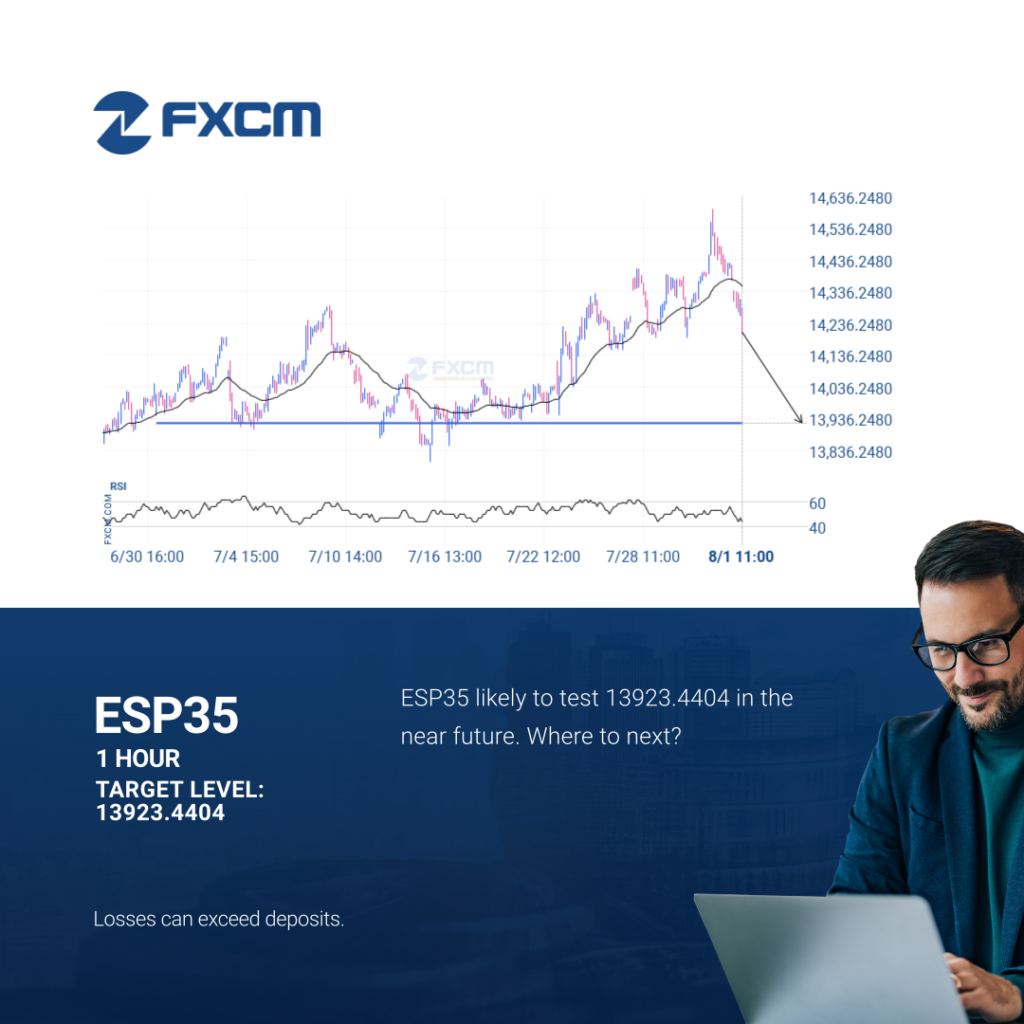
The price of ESP35 in heading back to the support area. It is possible that it will struggle to break through it and move back in the other direction. The price may eventually break through, but typically the price retreats from the level a number of times before doing so. Past performance is not an […]
¿Deberíamos esperar una irrupción o una recuperación del ESP35?

El precio de ESP35 ha vuelto a la zona de soporte. Es posible que tenga dificultades para atravesarla y que retroceda en la otra dirección. El precio eventualmente puede romper, pero normalmente el precio rebota en el nivel varias veces antes de hacerlo. El rendimiento pasado no es indicativo de resultados futuros. Las pérdidas pueden […]
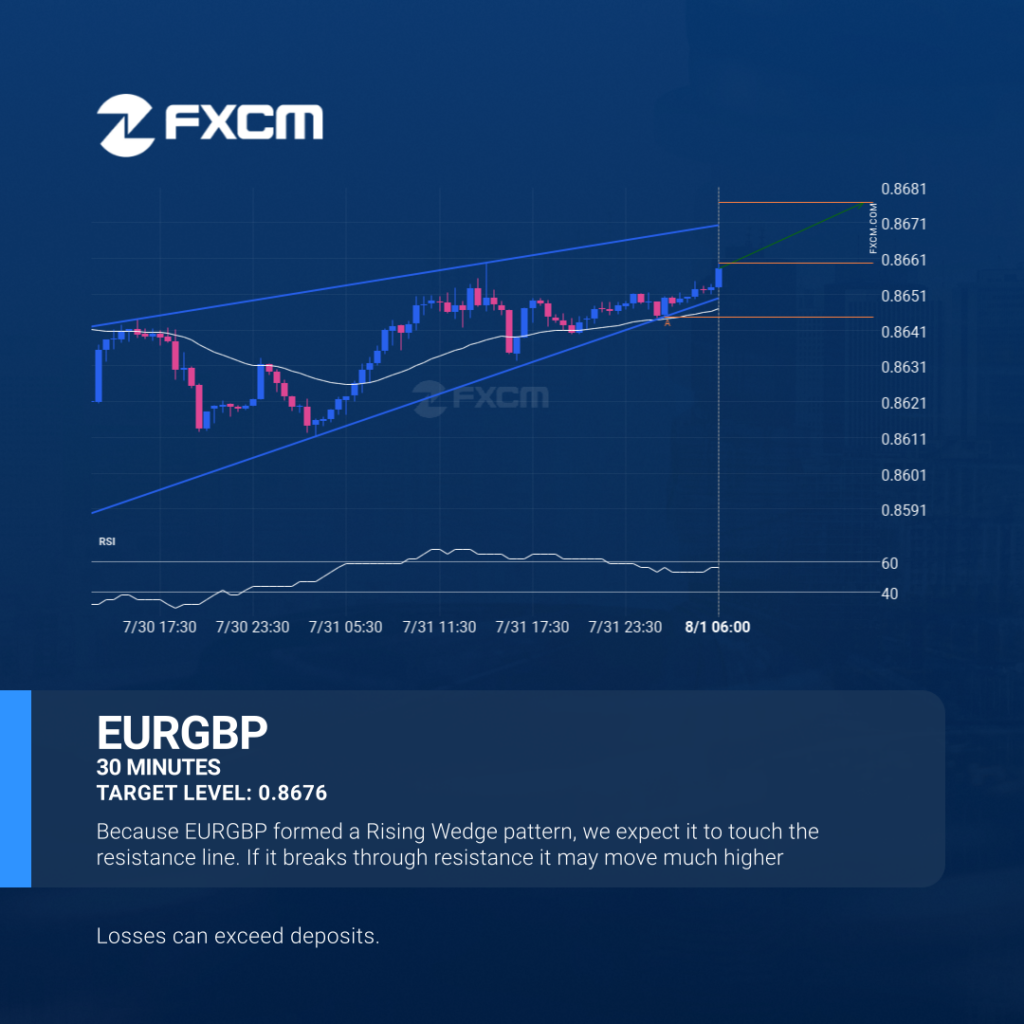
A potential bullish movement on EURGBP
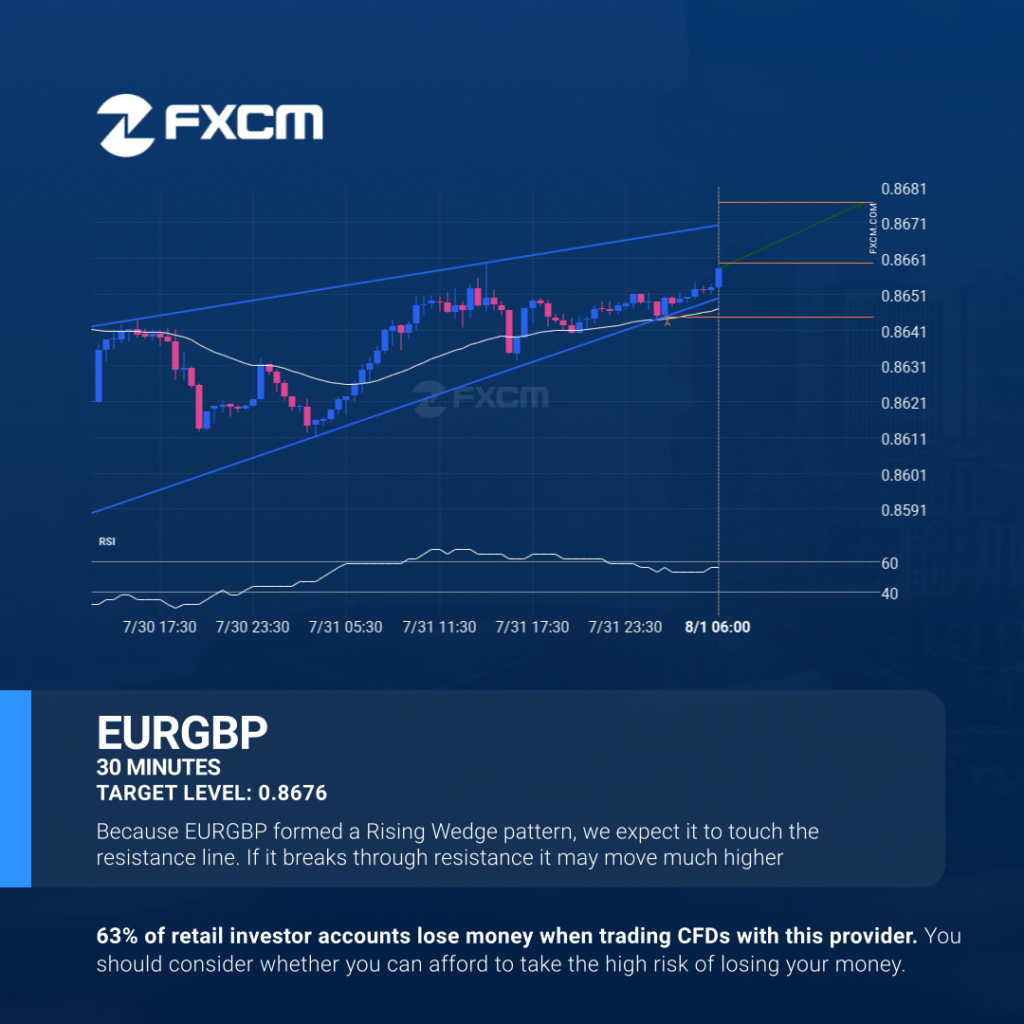
EURGBP is trapped in a Rising Wedge formation, implying that a breakout is Imminent. This is a great trade-setup for both trend and swing traders. It is now approaching a support line that has been tested in the past. Divergence opportunists may be very optimistic about a possible breakout and this may be the start […]
Un posible movimiento alcista en EURGBP
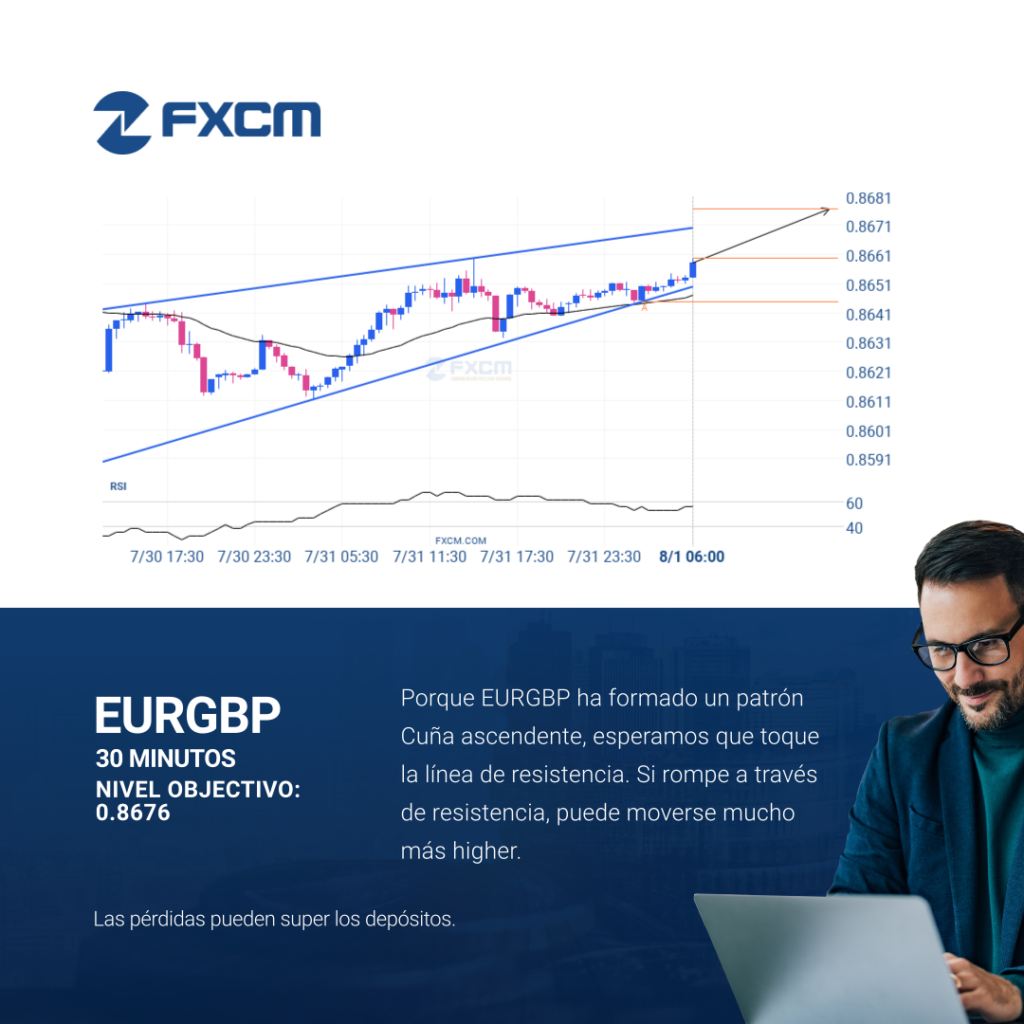
El patrón de Cuña ascendente emergente en su ola final se identificó en el gráfico de 30 Minutos de EURGBP. Después de un fuerte movimiento alcista, encontramos que EURGBP se dirige hacia la línea del triángulo superior con una posible resistencia en 0.8676. Si resulta que el nivel de resistencia aguanta, el patrón de Cuña […]
A potential bullish movement on EURGBP
EURGBP is trapped in a Rising Wedge formation, implying that a breakout is Imminent. This is a great trade-setup for both trend and swing traders. It is now approaching a support line that has been tested in the past. Divergence opportunists may be very optimistic about a possible breakout and this may be the start […]
A potential bullish movement on EURGBP
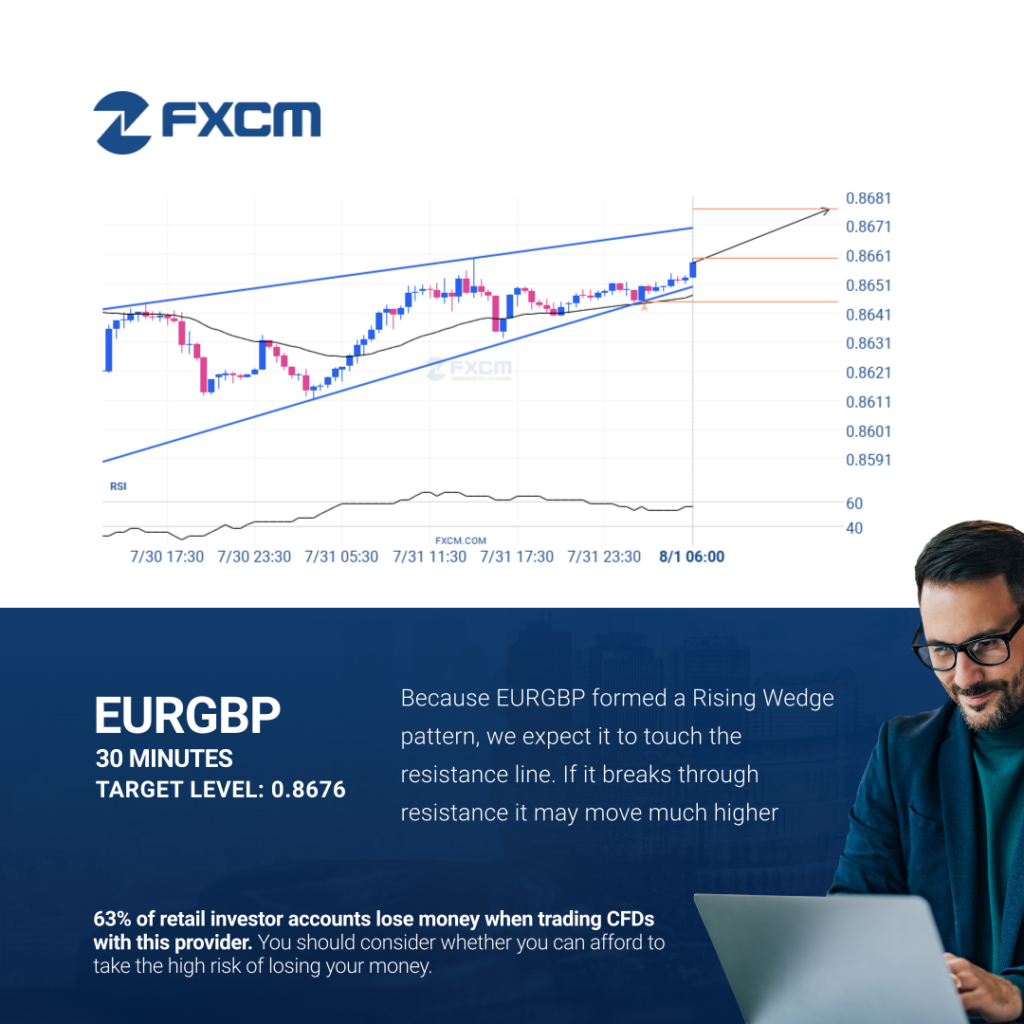
EURGBP is trapped in a Rising Wedge formation, implying that a breakout is Imminent. This is a great trade-setup for both trend and swing traders. It is now approaching a support line that has been tested in the past. Divergence opportunists may be very optimistic about a possible breakout and this may be the start […]
XAGUSD has broken through resistance
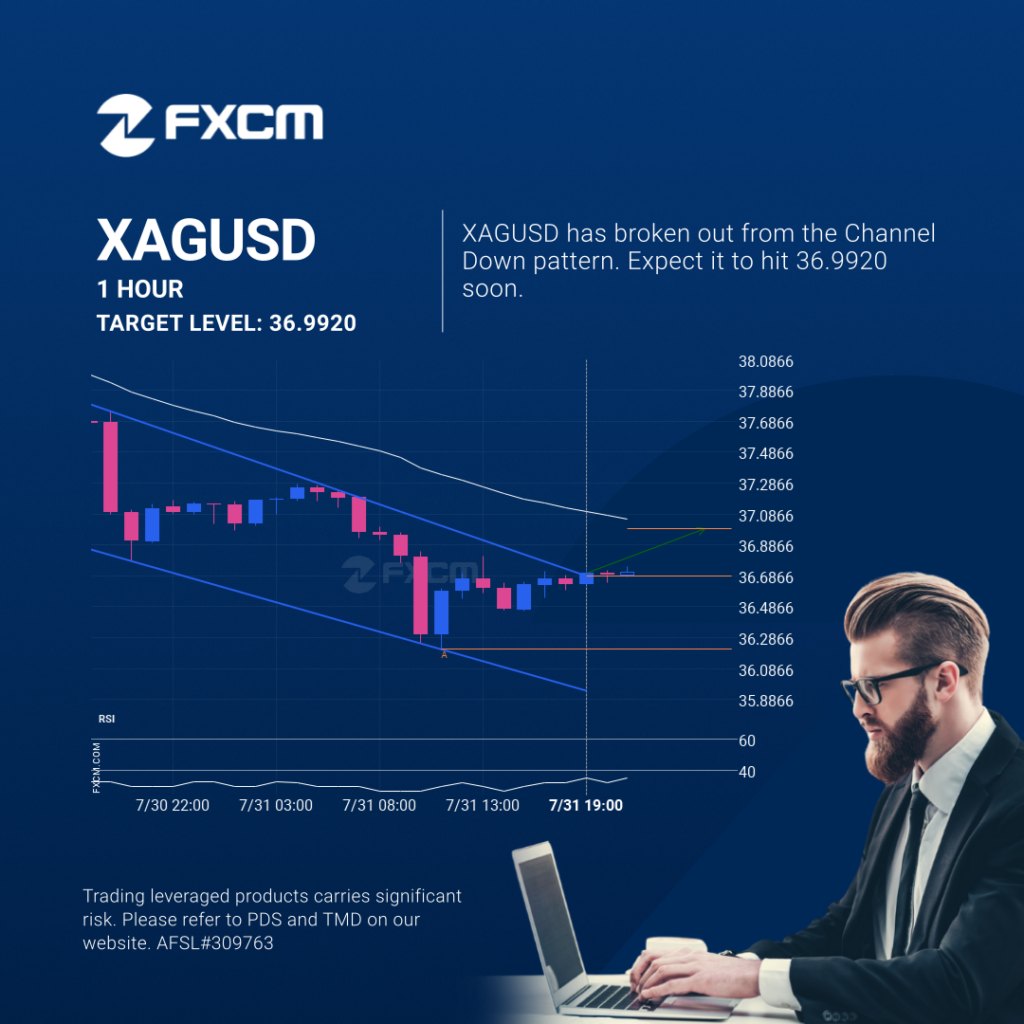
XAGUSD has broken through a resistance line of a Channel Down and suggests a possible movement to 36.9920 within the next 5 hours. It has tested this line in the past, so one should probably wait for a confirmation of this breakout before taking action. If the breakout doesn’t confirm, we could see a retracement […]