Se espera la posibilidad de un gran movimiento en el AUDUSD
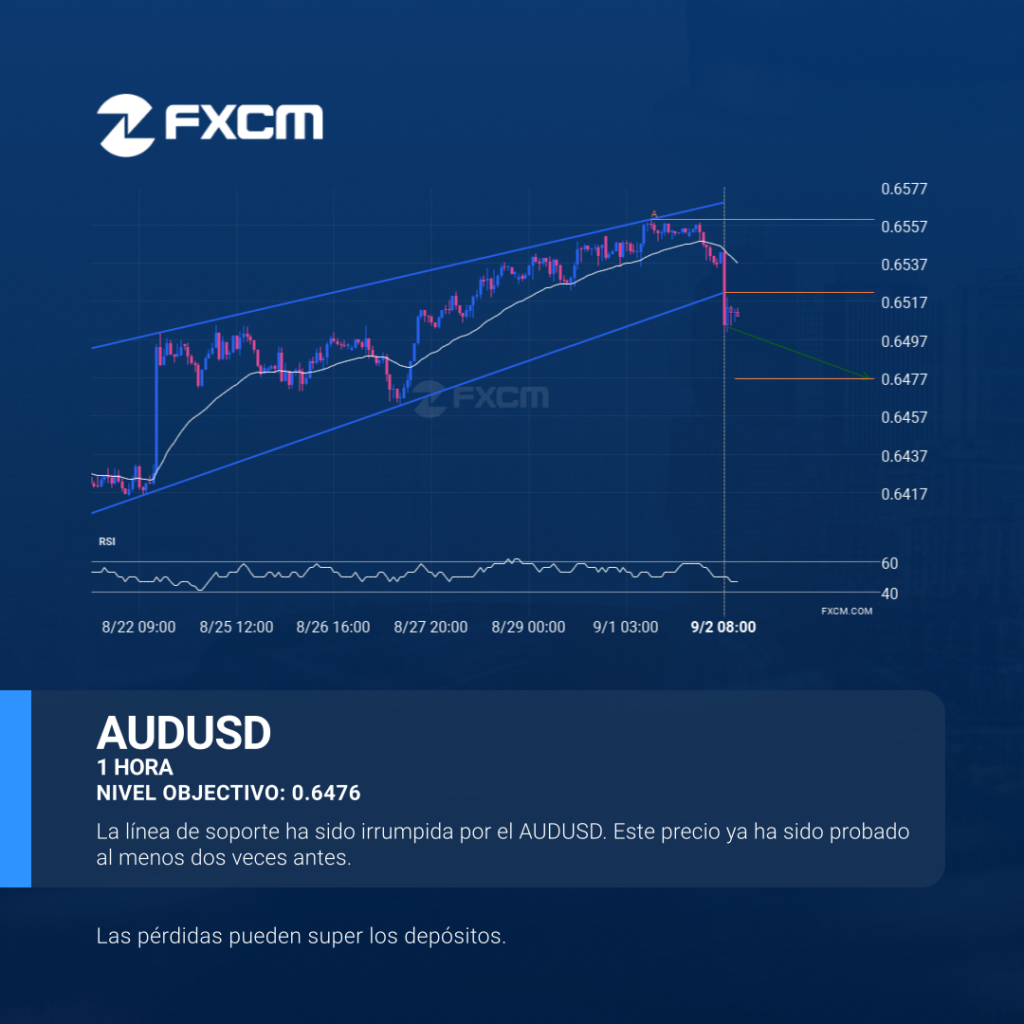
El patrón de Canal alcista identificado en AUDUSD ha atravesado un nivel de soporte y el impulso del precio continúa moviéndose en dirección bajista. Continúa siendo una buena oportunidad de trading y se espera que el precio alcance 0.6476 en un plazo de 3. El rendimiento pasado no es indicativo de resultados futuros. Las pérdidas […]
Possible start of a bearish trend on ESP35
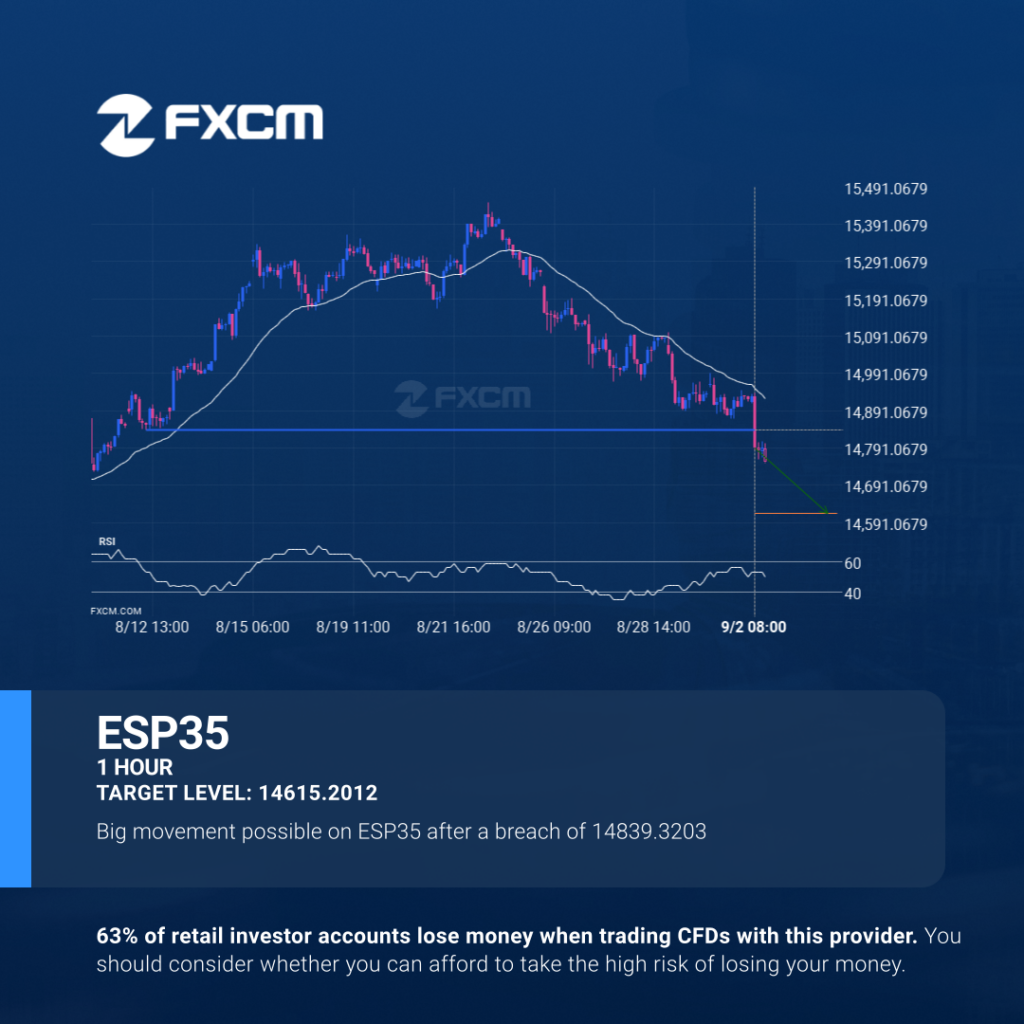
A strong support level has been breached at 14839.3203 on the 1 hour ESP35 chart. Technical Analysis theory forecasts a movement to 14615.2012 in the next 2 days. Past performance is not an indicator of future results. Trading leveraged products carries significant risk. Please refer to PDS and TMD on our website. AFSL#309763
Possible start of a bearish trend on ESP35
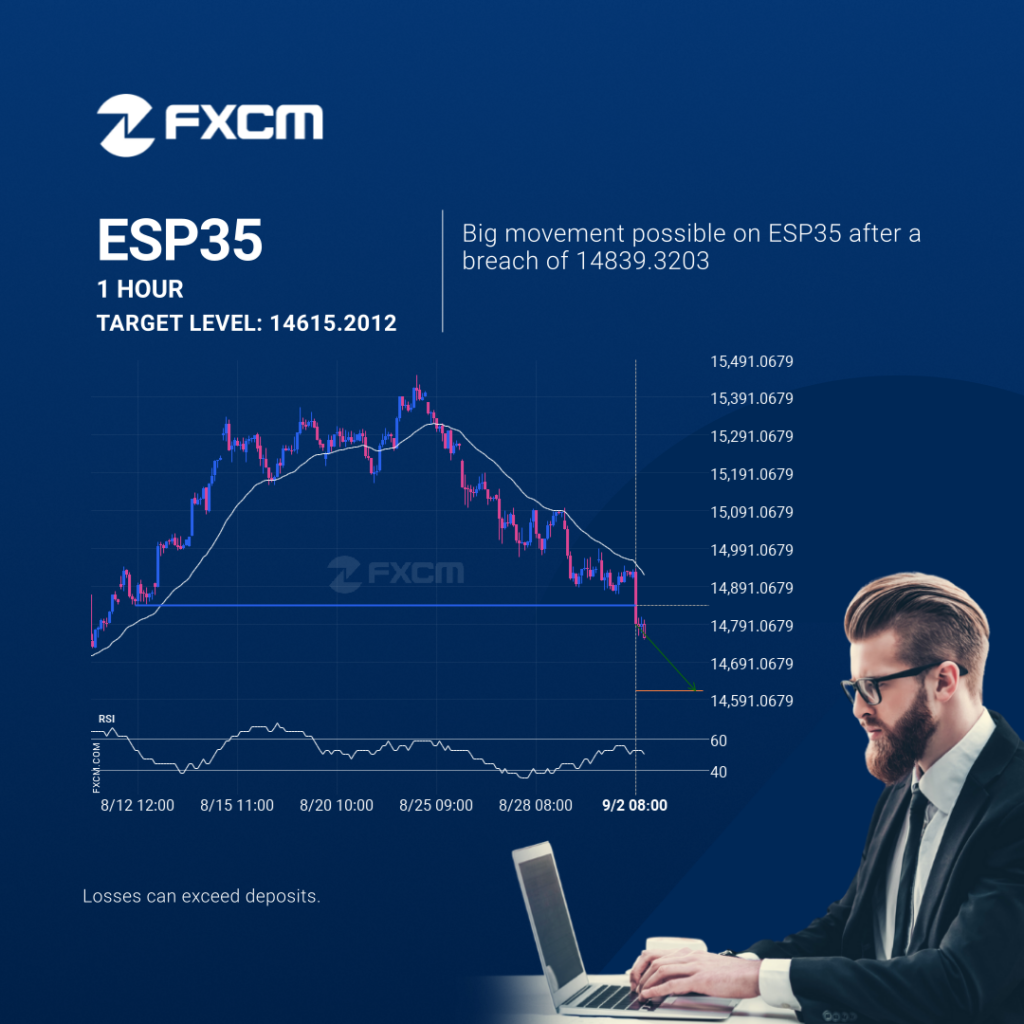
A strong support level has been breached at 14839.3203 on the 1 hour ESP35 chart. Technical Analysis theory forecasts a movement to 14615.2012 in the next 2 days. Past performance is not an indicator of future results. Losses can exceed deposits.
Posible comienzo de una tendencia bajista en el ESP35
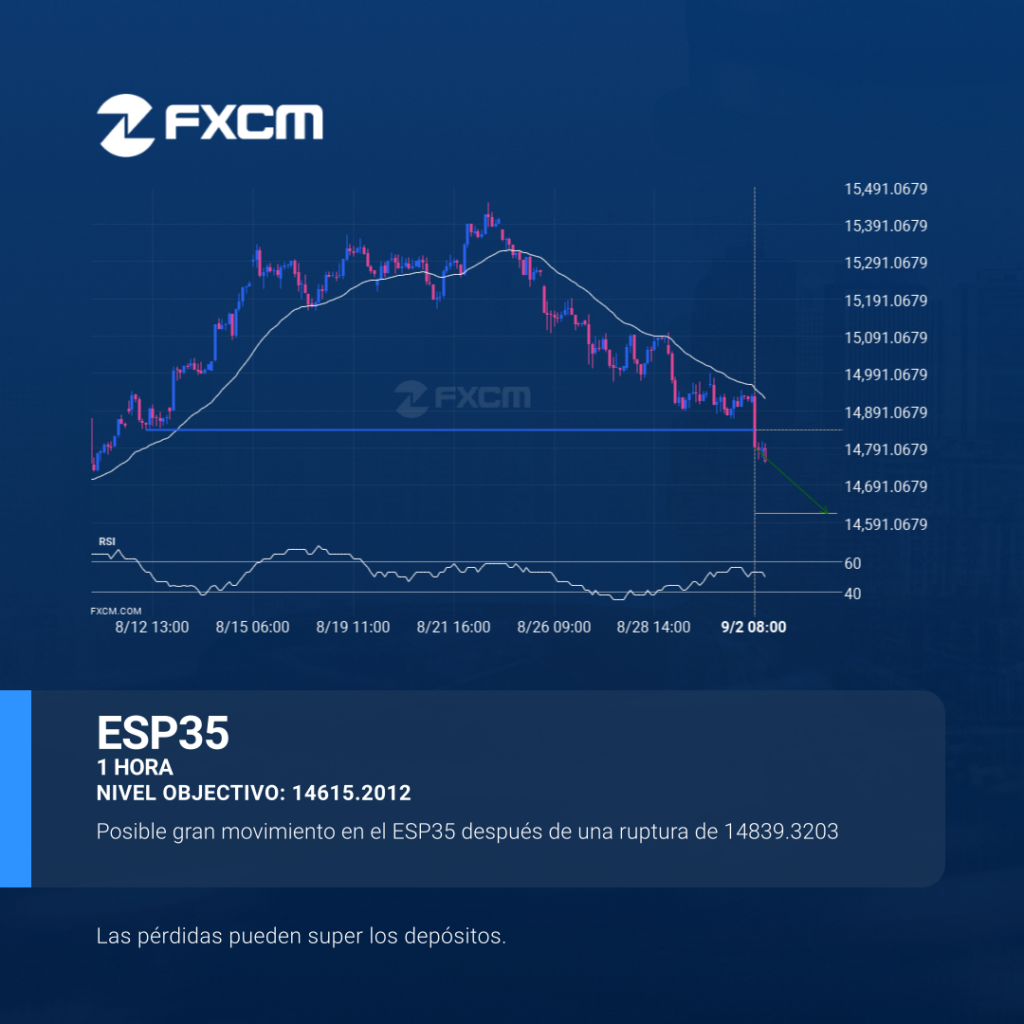
Se ha atravesado un fuerte nivel de soporte en 14839.3203 en el gráfico de 1 Hora de ESP35. La teoría del análisis técnico pronostica un movimiento a 14615.2012 en el próximo período de 2 días. El rendimiento pasado no es indicativo de resultados futuros. Las pérdidas pueden exceder los fondos depositados.
Continuation pattern on EURJPY
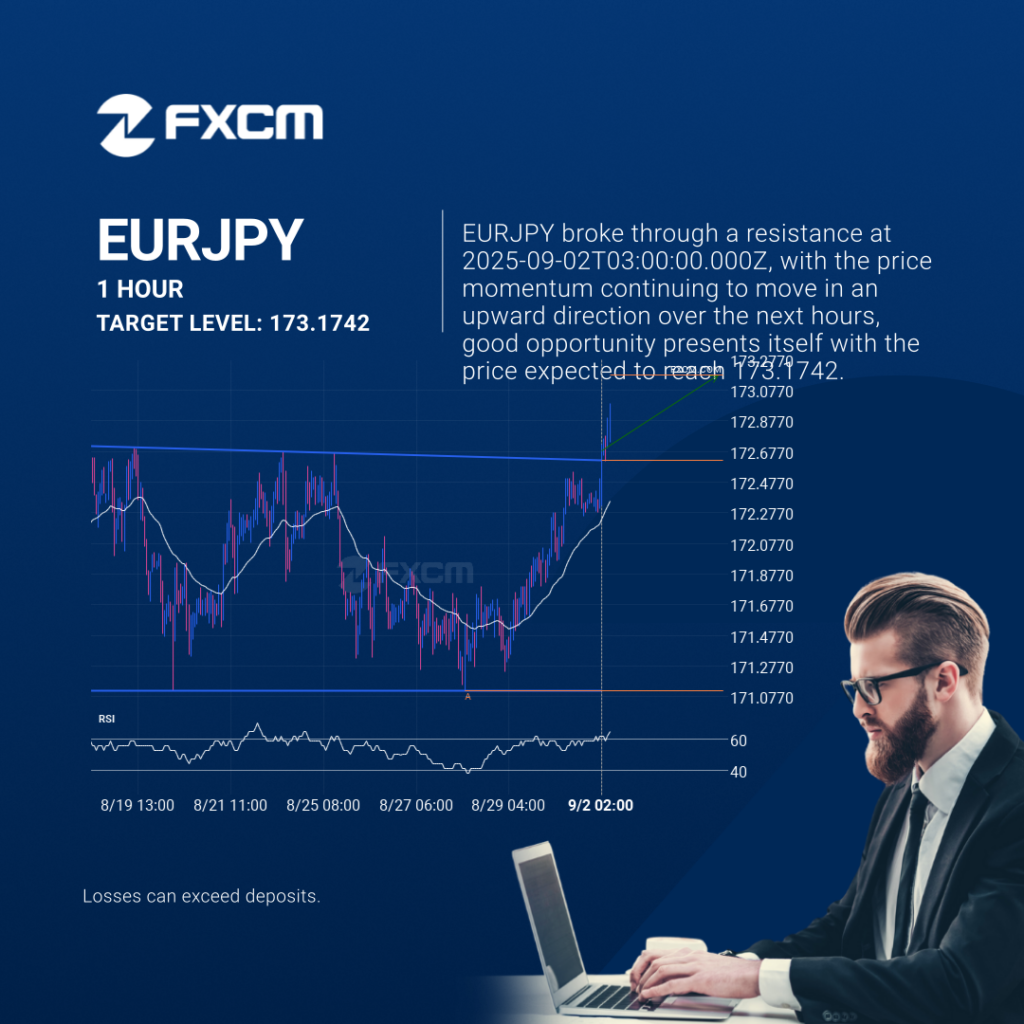
EURJPY has broken through the resistance line which it has tested twice in the past. We have seen it retrace from this line before, so one should wait for confirmation of the breakout before trading. If this new trend persists, a target level of around 173.1742 may materialize within the next 4 days. Past performance […]
Patrón Continuation en EURJPY
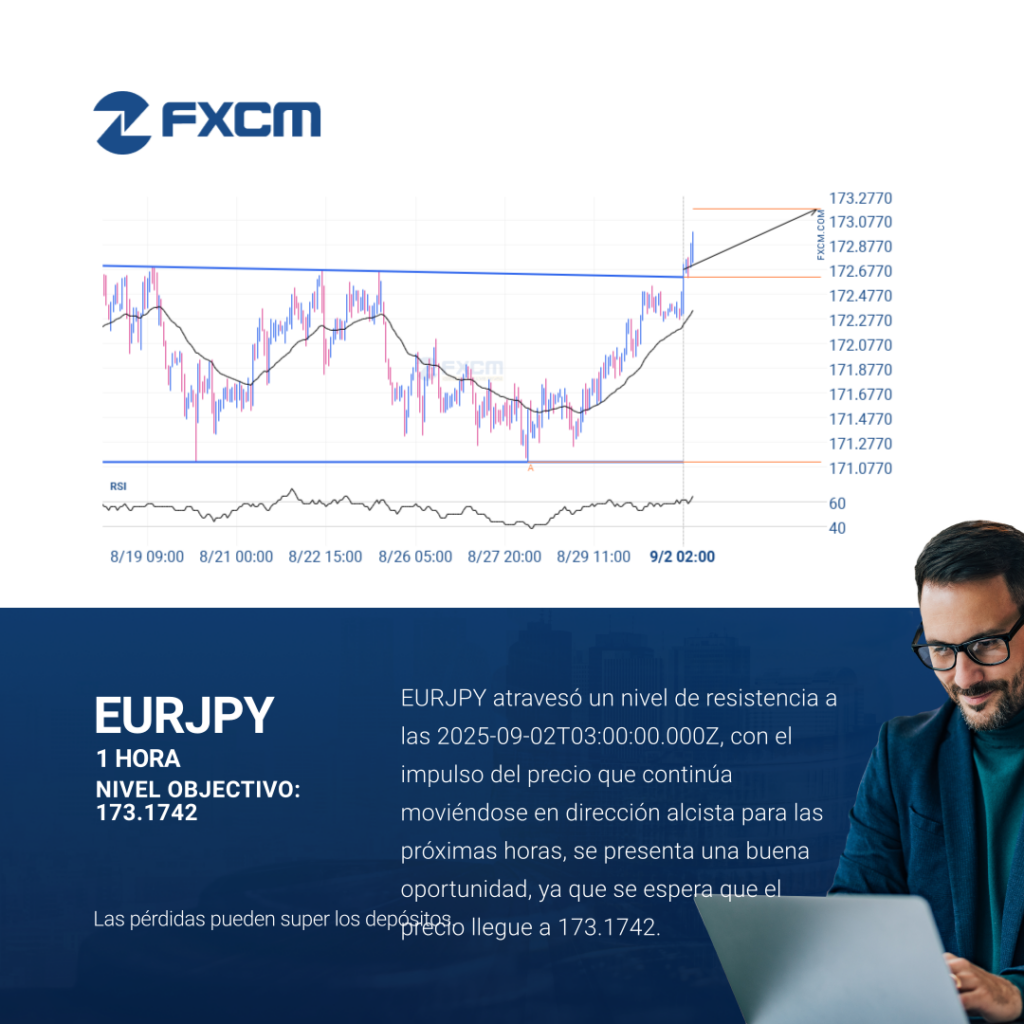
El EURJPY ha atravesado la línea de resistencia, que ya se ha probado dos veces en el pasado. Hemos visto, anteriormente, un retroceso desde esta posición, así que debemos esperar la confirmación de la ruptura antes de operar. Si esta nueva tendencia persiste, un nivel objetivo alrededor de 173.1742 podría materializarse dentro de las próximas […]
Continuation pattern on EURJPY
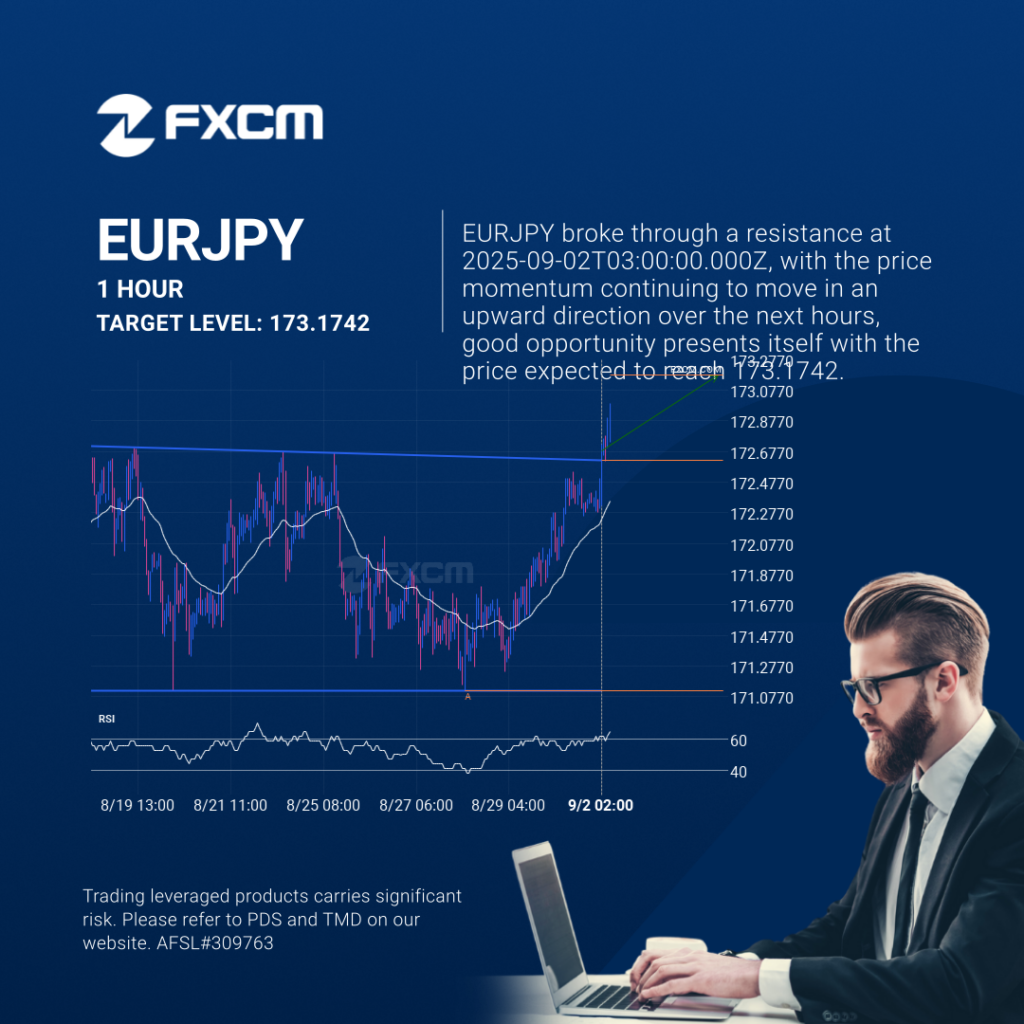
EURJPY has broken through the resistance line which it has tested twice in the past. We have seen it retrace from this line before, so one should wait for confirmation of the breakout before trading. If this new trend persists, a target level of around 173.1742 may materialize within the next 4 days. Past performance […]
Either a rebound or a breakout imminent on HKG33
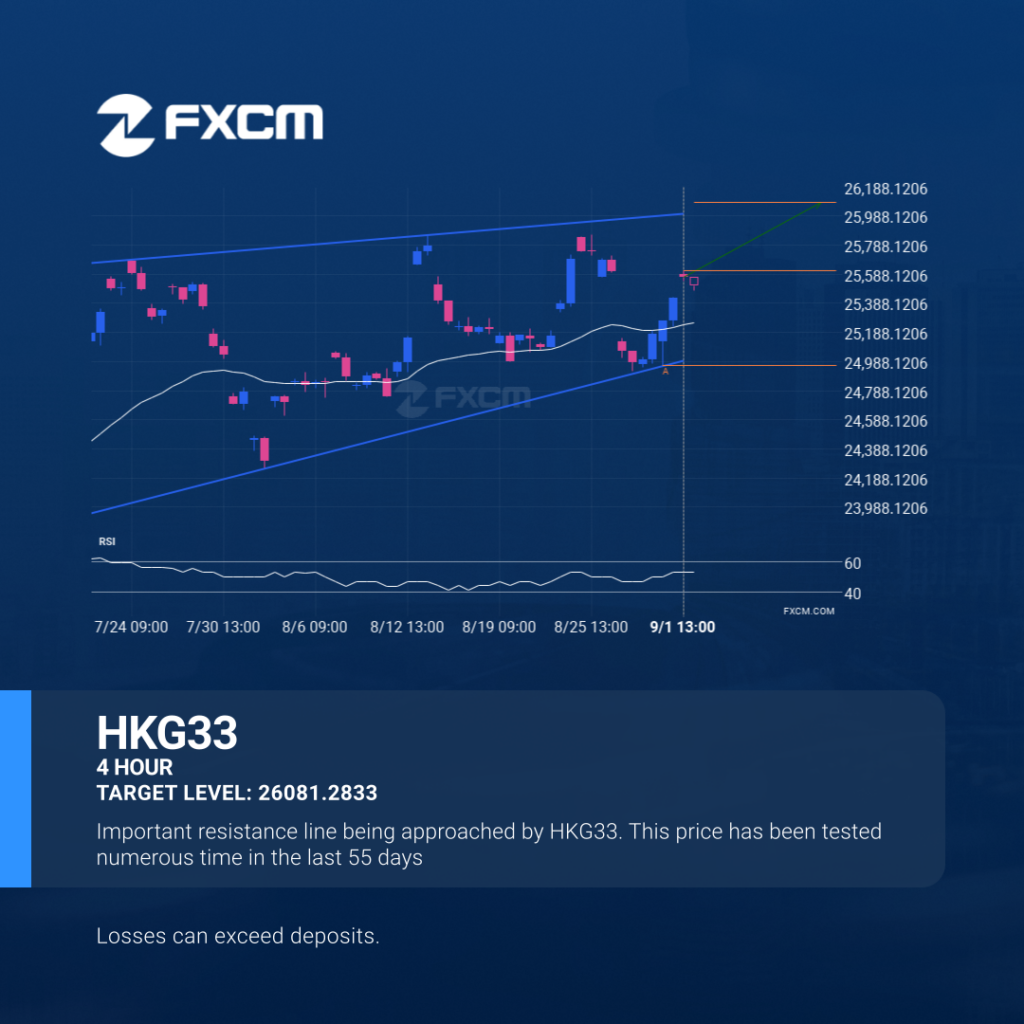
A Rising Wedge pattern was identified on HKG33 at 25611.74, creating an expectation that it may move to the resistance line at 26081.2833. It may break through that line and continue the bullish trend or it may reverse from that line. Past performance is not an indicator of future results. Losses can exceed deposits.
Inminente recuperación o irrupción del HKG33

HKG33 está atrapado en una formación de Cuña ascendente, lo que implica que una rotura es inminente. Esta es una excelente configuración de trading tanto para los operadores de tendencia como para los de swing. Ahora se está acercando a una línea de soporte que se testeó en el pasado. Los oportunistas de la divergencia […]
Posible gran movimiento en el BTCUSD

El BTCUSD atravesó la línea de resistencia. Como ya lo hemos visto retroceder desde esta posición en el pasado, deberíamos esperar la confirmación de la ruptura antes de operar. Ha llegado a esta línea en numerosas ocasiones en los últimos 3 días, lo cual sugiere un posible nivel objetivo alrededor de 110936.6094 dentro de las […]